Distribution Days


Category:
0
0

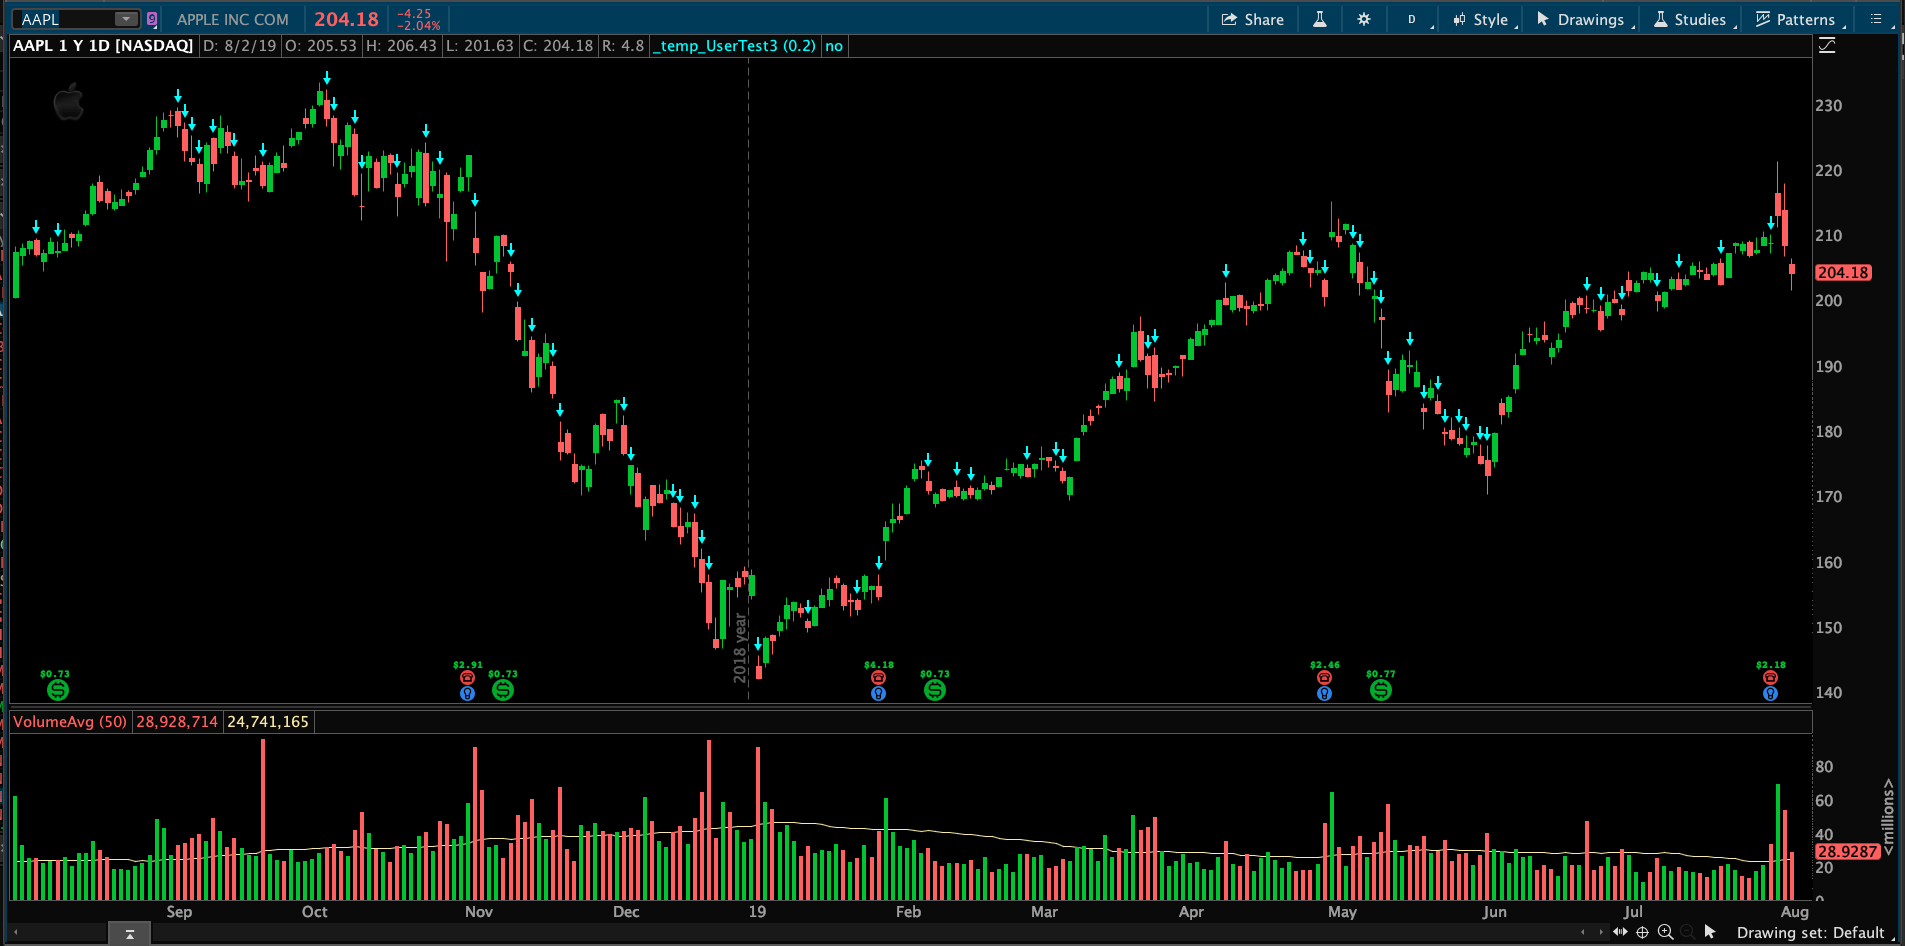
Hi Pete,

Can you suggest a script to mark distribution days on the charts? Distribution days, as defined by Investor’s Business Daily, are days where the price declines by more than 0.2% and the day’s volume is higher than the previous day. The distribution bars could be marked with an arrow or indicated by a different color.

Thanks.

Marked as spam
Posted by (Questions: 7, Answers: 5)
Asked on August 1, 2019 7:04 pm
78 views
0
Private answer

input percentDrop = 0.2;
plot distributionDay = close < close[1] * (1 - (percentDrop * 0.01)) and volume > volume[1];
distributionDay.SetPaintingStrategy(PaintingStrategy.BOOLEAN_ARROW_DOWN);

Screenshot below shows the result.

Attachments:
Marked as spam
Posted by (Questions: 37, Answers: 4087)
Answered on August 2, 2019 11:22 am
0
Thank you, Pete. You're the best.
( at August 3, 2019 5:44 am)