| ♥ 0 |
Hello is it possible you can hemp me with the script that change color to yellow of the volume bar if the volume is over 5000000 def paintbar = volume > 500000;
this change color on upper chart but i was looking at lower volume> Thanks
Marked as spam
Asked on July 20, 2021 12:11 pm
547 views
|
|
Private answer
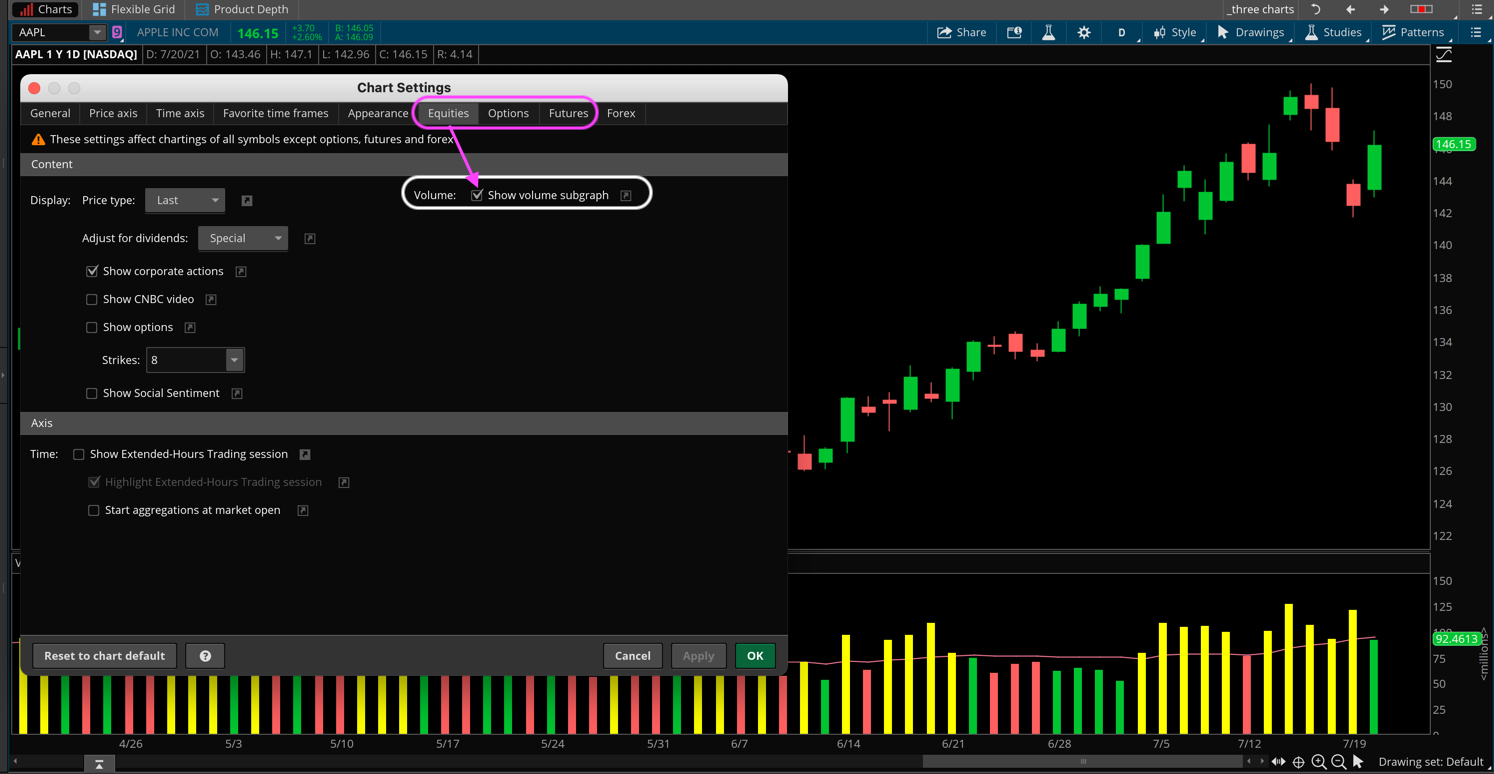
In this forum we do the best we can to provide solutions that serve the broadest possible audience. Using a fixed value for the volume test such as you requested does not fit that model. A fixed value for volume is completely useless when trying to apply this tool to a wide range of stocks. For some stocks or time frames, a volume of 5,000,000 would be every signal bar on the chart. For other stocks or time frames that same value would never be achieved. So when you have a request in the future please consider the rest of our viewers and also consider that most of the trading tools in use are designed in such a way that they automatically adapt to the widest possible range of stocks and futures contracts. I perceive that you are trying to write some code to change the plot colors on the built-in volume subgraph included with Thinkorswim. So my solution below is adapted to that portion of the chart. For those that want to use this code on their own charts, simply go into the chart settings and turn on the settings named "Show volume subgraph" for the "Equities", "Options" and "Futures" tabs. This solution adds a plot to display the average volume. The bars are colored yellow when volume is greater than average. For bars that do not exceed average volume the bars are colored the same as the candles on the chart.
For those who are curious about how we achieved this, please check the following link: https://toslc.thinkorswim.com/center/reference/thinkScript/Declarations/weak-volume-dependency Screenshot below shows what this looks like on the chart. Attachments:
Marked as spam
Answered on July 20, 2021 1:04 pm
|