| ♥ 0 |
Hi Pete, I would like to know if there is a way to plot the expected move levels up and down before earnings announcement on the chart.
Marked as spam
Asked on June 1, 2018 7:22 pm
720 views
|
|
Private answer
I have had numerous requests for this. I have not found a user friendly way to accomplish this. It’s just easy enough to plot the lines manually then try to apply a more advanced solution. Marked as spam
Answered on June 2, 2018 8:16 am
|
|||||
|
Private answer
Thanks to the comment added by "S Mark" I know have a custom solution for this. I am surprised that I missed this. Shocked actually. When I reviewed the link provided by "S Mark" I immediately searched for the release notes showing when this new function was added. The function name is GetMarketMakerMove() and it was added in April 2015. How on earth did I miss this? Details here: https://toslc.thinkorswim.com/center/release/rel-04-18-2015#section_2 Then I found the language reference here: So here is the code to build a chart study that plots the two lines based on the close of the previous bar. This ensures the levels will be active for the current live bar on the daily time frame. (this is really not meant for intraday time frames but a slight modification can make that work too).
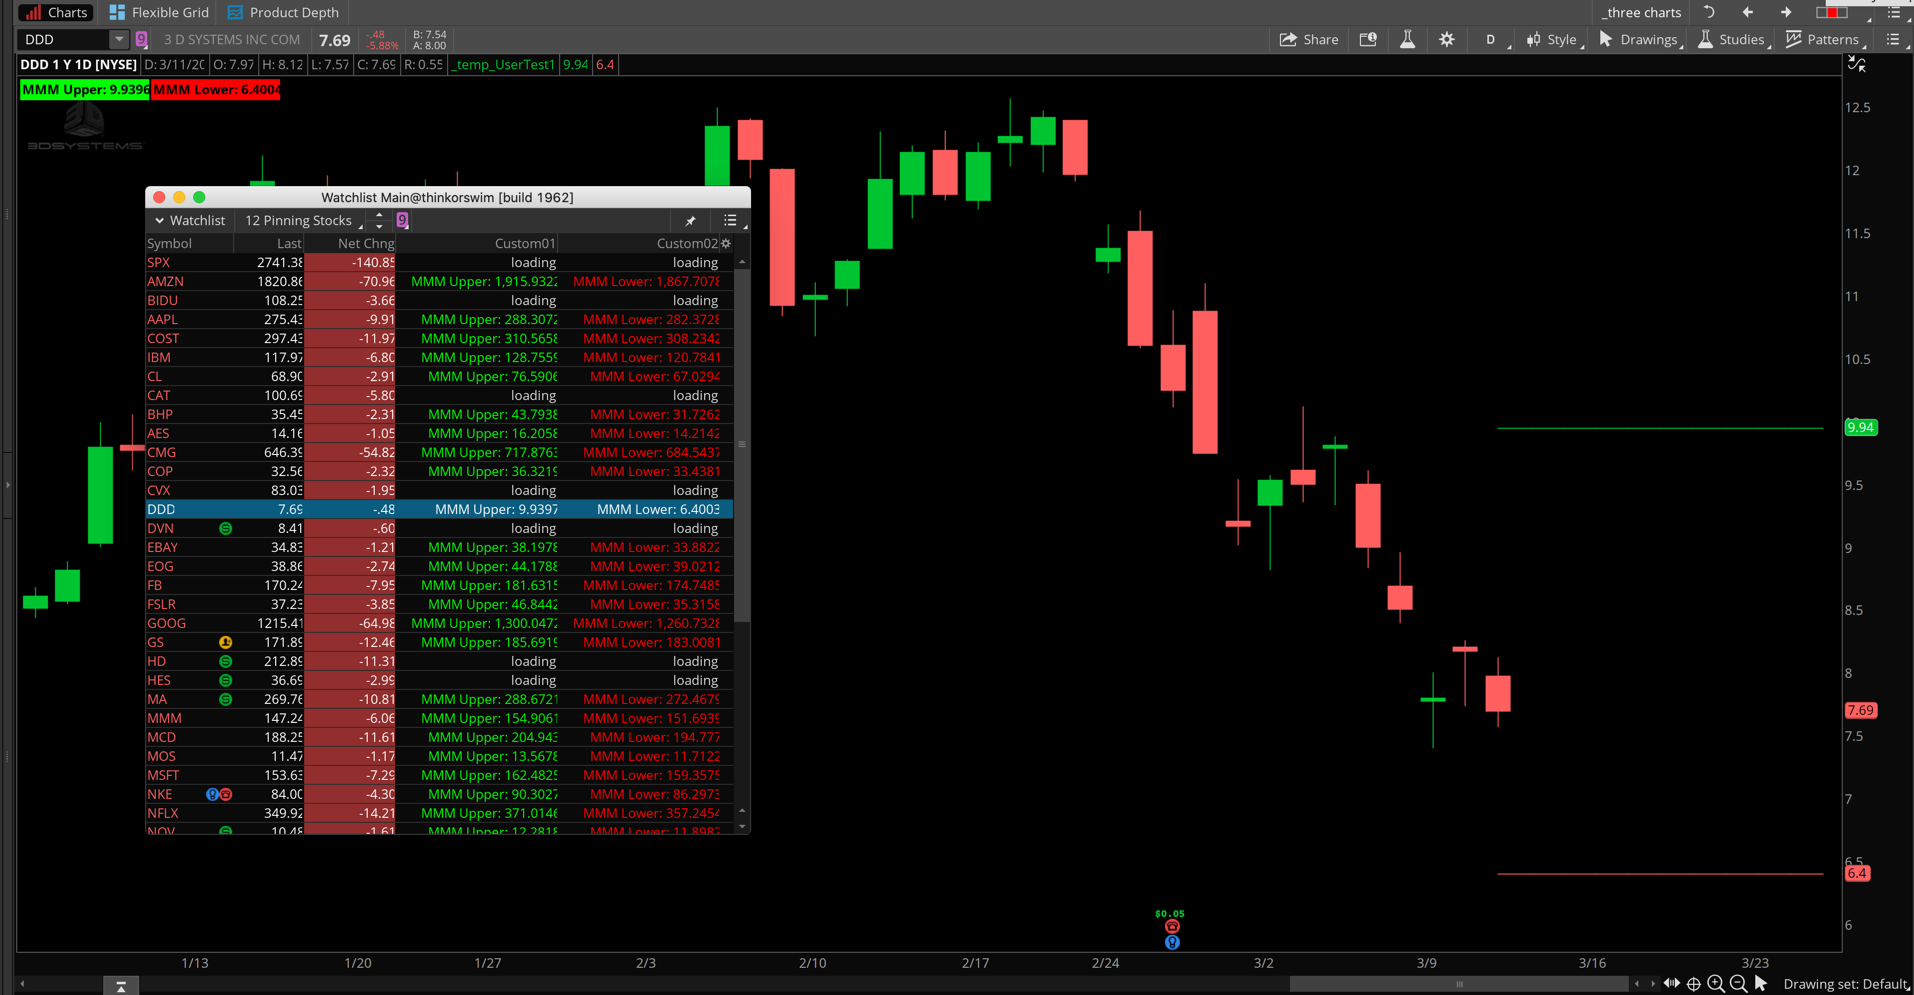
I also built a version of this for a custom watchlist column. There are two versions of this. One to display the MMM upper limit and the other to display the MMM lower limit (two separate custom columns). Custom column for MMM upper limit:
Custom column for MMM lower limit:
Screenshot below shows the results. Be sure to read the release notes before complaining this doesn't work for every stock. The value is only computed under specific conditions. So not every stock will have an MMM value to plot. It all depends on current pricing in the options market for the underlying stock. Attachments:
Marked as spam
Answered on March 11, 2020 5:26 pm
|