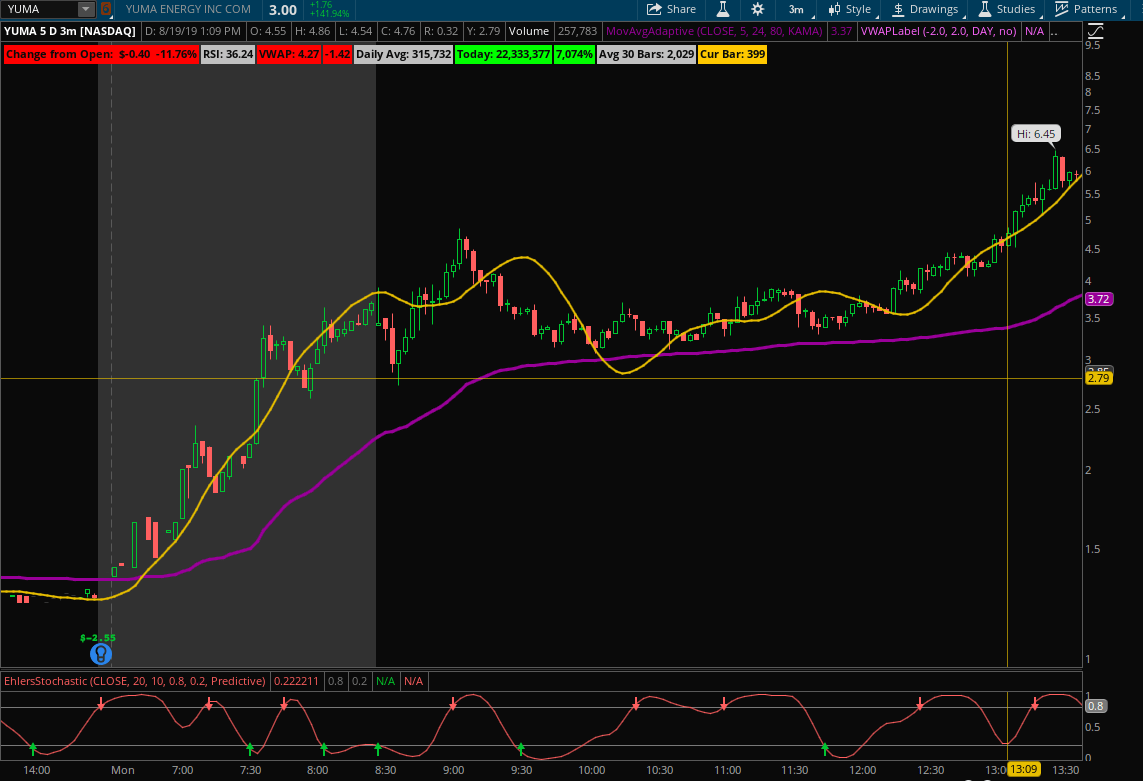
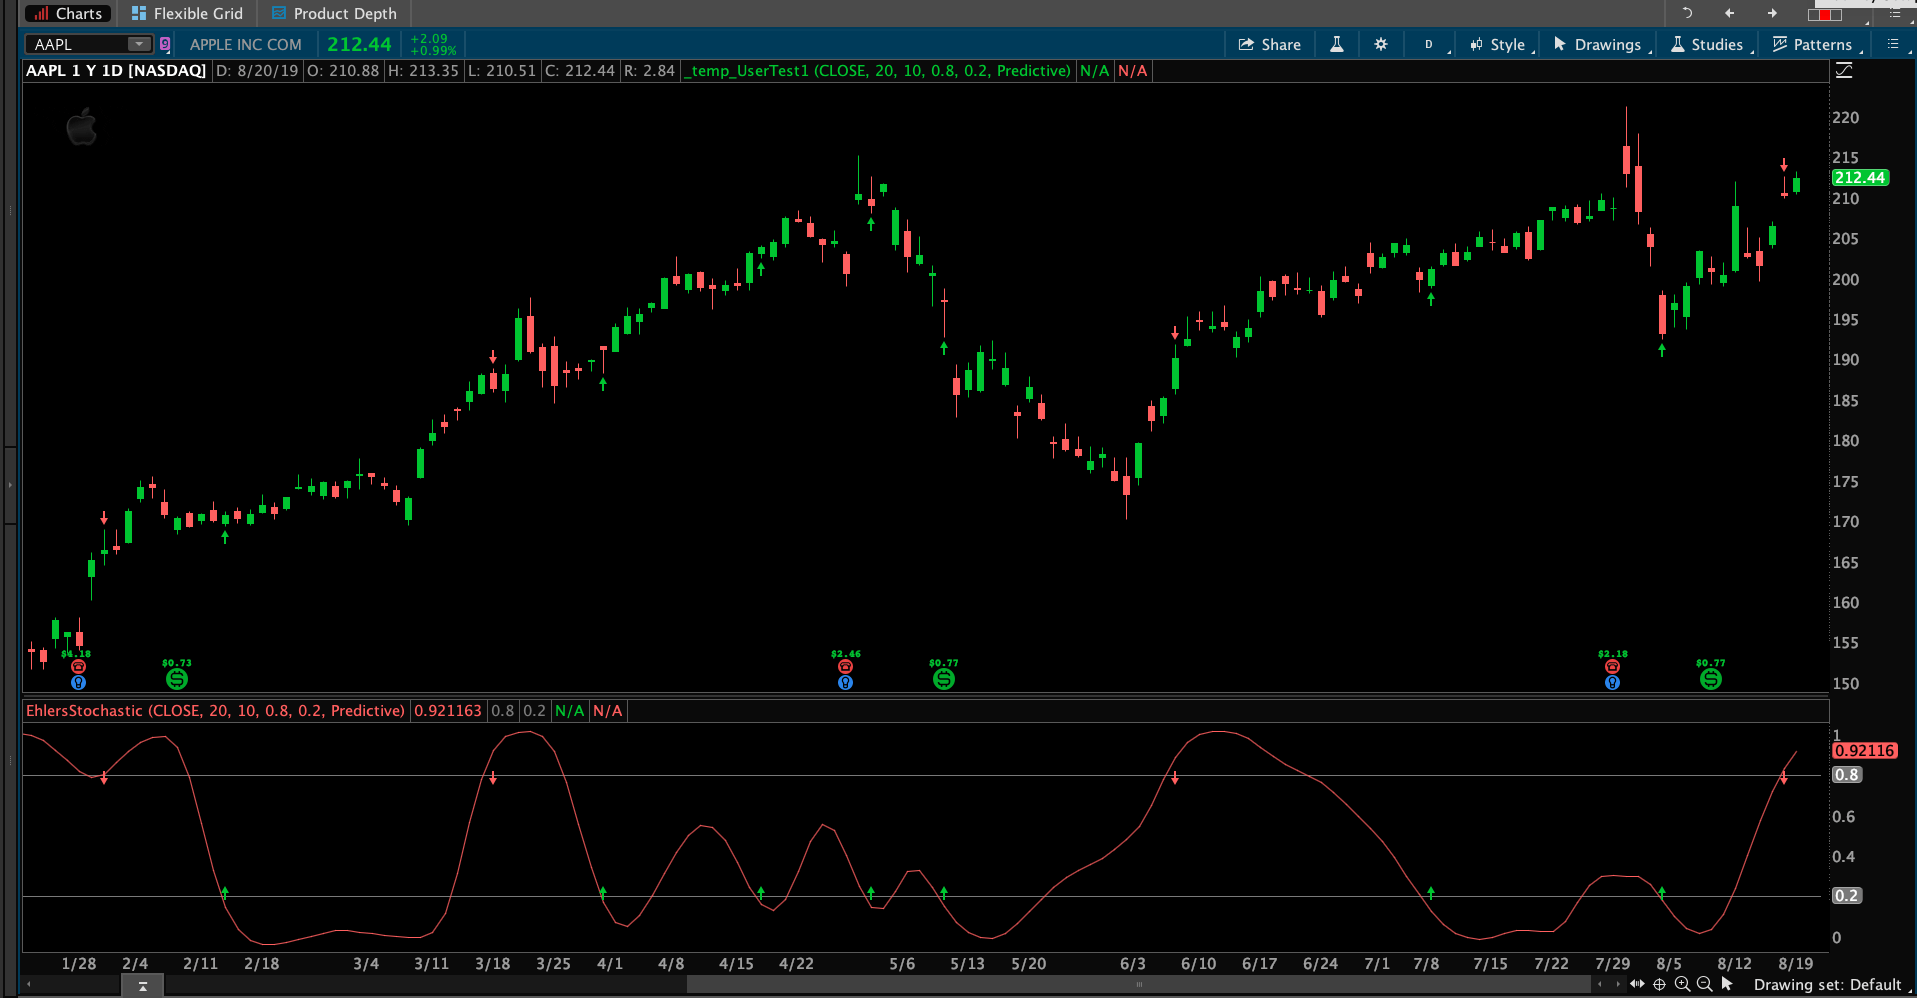
Plotting the arrows at the close for the sell signals would make the arrows more difficult to see than plotting them at the high. Here is the code. Screenshot below shows the result.
input price = close;

input length = 20;

input cutoffLength = 10;

input over_bought = 0.8;

input over_sold = 0.2;

input mode = {default Predictive, Conventional};

def filt = reference EhlersRoofingFilter(price, cutoffLength);

def highestP = Highest(filt, length);

def lowestP = Lowest(filt, length);

def stoch = if (highestP - lowestP) != 0 then (filt - lowestP) / (highestP - lowestP) else 0;

def Stochastic = reference EhlersSuperSmootherFilter(stoch, cutoffLength);

def OverBought = over_bought;

def OverSold = over_sold;

plot Buy;

plot Sell;

switch (mode) {

case Predictive:

Buy = if Stochastic crosses below OverSold then OverSold + 0.05 else Double.NaN;

Sell = if Stochastic crosses above OverBought then OverBought - 0.05 else Double.NaN;

case Conventional:

Buy = if Stochastic crosses above OverSold then OverSold + 0.05 else Double.NaN;

Sell = if Stochastic crosses below OverBought then OverBought - 0.05 else Double.NaN;

}

Buy.SetDefaultColor(Color.UPTICK);

Buy.SetPaintingStrategy(PaintingStrategy.BOOLEAN_ARROW_UP);

Buy.HideBubble();

Sell.SetDefaultColor(Color.DOWNTICK);

Sell.SetPaintingStrategy(PaintingStrategy.BOOLEAN_ARROW_DOWN);

Sell.HideBubble();