Exclude stocks that make new highs


Category:
0
0

Hi Pete, can you please make a scan to exclude stocks that are making new 50 day highs.

Marked as spam
Posted by (Questions: 12, Answers: 20)
Asked on July 12, 2020 7:13 pm
39 views
0
Private answer

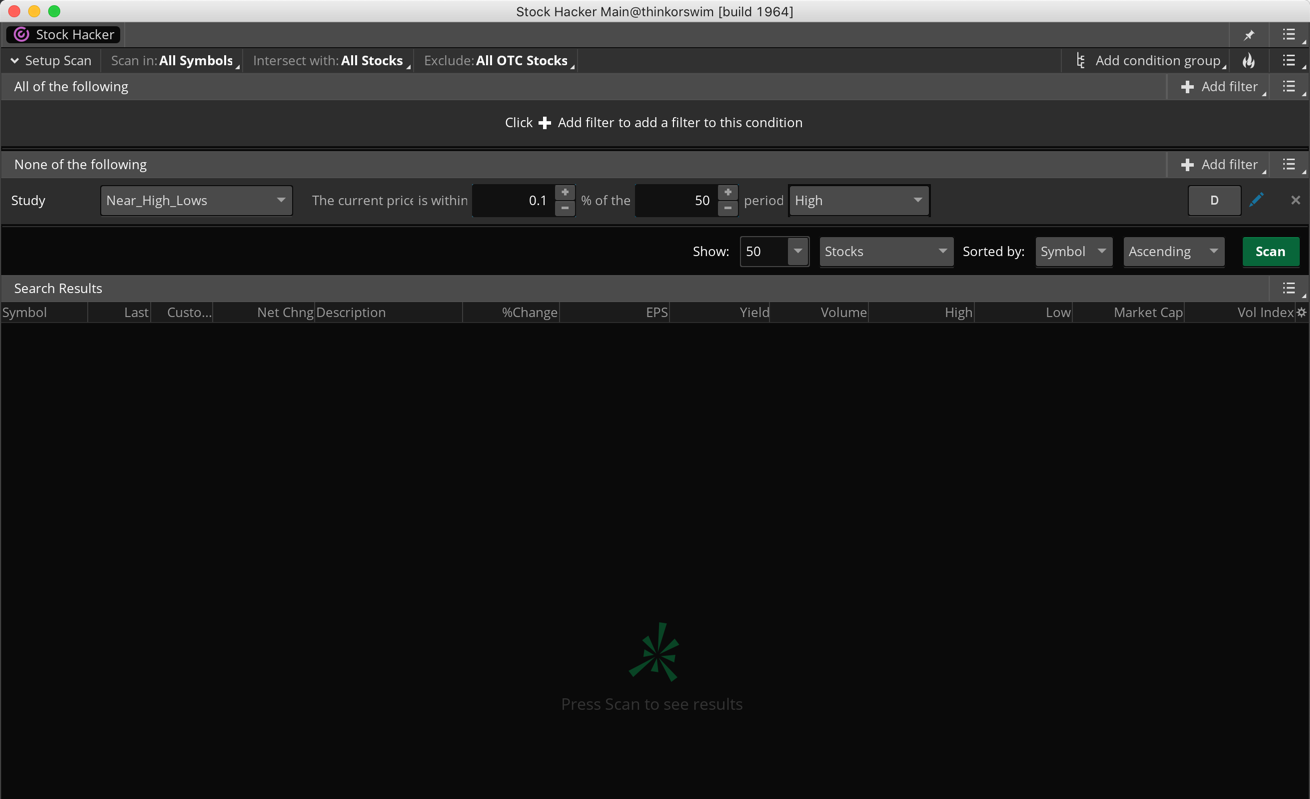
This is already available using standard built-in tools. Screenshot below shows how to set this up. I set the percent threshold to 0.1 because when a stock makes a new 50 day high it is likely to be fluctuating a bit. You will want to experiment with different values. A percent threshold of zero would require the price to currently trading at exactly the 50 day high at the moment the scan is run. So I suggest you go the other direction, 0.5 or 1.0.

Notice the key point that makes this work is the filter has been added to the "Condition Group" named "None of the following".

Edit: Based on further clarification provided in the comments section below I have a section of code to provide the solution.

input targetPeriod = 50;
def newPeriodHigh = high > Highest(high[1], targetPeriod);
plot scan !newPeriodHigh;

The target period is an adjustable use input. The code checks if the current bar's HIGH is greater than the previous target period HIGH. The plot statement on the last line uses the "!" operator which is the same as saying "Not newPeriodHigh". So we create a variable that is true when the undesiarable pattern is present. Then we write our plot statement to say "anything except that".

How is this different then my original solution using the built-in study filter as shown in the screenshot below? The built-in version checks the current price (the close of the candle) and does not check the high of the candle.

Attachments:
Marked as spam
Posted by (Questions: 37, Answers: 4087)
Answered on July 13, 2020 7:19 am
0
Hey Pete thank you for the response, I tried this yesterday on my own before making a post but it's still giving me results with stocks that made a new 50 day high. Some examples are: ZS, ZM, YNDX, XP, VSLR, etc. :(
( at July 13, 2020 9:55 am)
0
All of those stocks are more than 7 percent below their 50 day highs. Those stocks should absolutely appear in this scan. They are not making new 50 day highs. They are well below their 50 day highs. Perhaps you need to explain this request a bit more clearly because it's doing exactly what you requested.
( at July 13, 2020 1:46 pm)
0
Oh weird, I wasn’t aware I’ve been saying it incorrectly the past few years. Can you help me with the proper vocabulary? I’ll use ZS & ZM as an example of what I’m trying to say. ZS touched $129.00 today, price never touch $129.00 at any point within the last 50 trading days prior to today. ”Creating a new 50 day high” ( the way i thought it was supposed to be said ). Had it only went up to $128.74 ( 1 penny below 07/09/20 high of $128.75 ) it would’ve okay for it to pop up on my scanner. But because the high surpassed $128.75 I wouldn’t want it to pop up on the scanner at all. ZM same concept, touched $281. The stock never touched $281 within the last 50 trading days. So because it went past 07/10/20 high price of $278.16 I wouldn’t want this ticker to pop up on the scanner. Find highest high price in the last 50 days –> current candles high is below that price
( at July 13, 2020 8:40 pm)
0
I have updated my answer to include a solution to what you just clarified.
( at July 14, 2020 8:09 am)