Exporting Chart Study Labels to Text


Category:
0
0

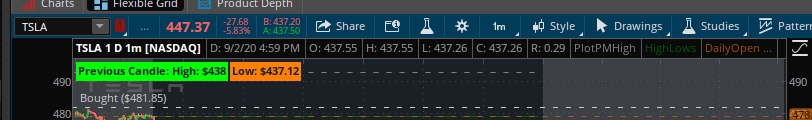
Pretty sure I know the answer to this, and did some searching, but thought to ask to confirm!
Is there anyway to copy a label on a chart study to text format / or to export the text?

Long story short, I’m tracking a pattern and have various data points – and would love to be able to copy the text displayed or export it rather than manually keying it in excel.

The other work-around is to use online software that convert images to text, and take a screenshot of the data – but that has resulted in various issues for me in the past.

Example image attached!
Thanks

Attachments:
Marked as spam
Posted by (Questions: 7, Answers: 9)
Asked on September 2, 2020 6:35 pm
71 views
0
Private answer

Take the code used to generate the chart label, strip out everything that is not needed, then apply that as a custom watchlist column under the MarketWatch tab. (chart labels appear as values in the custom watchlist column). Then use the Export To Excel function. (only works on Windows version). Aside from this it is not currently possible to directly export anything from a chart into Excel.

Better yet, take the text out of the label and only display the value in the custom watchlist Column. Saves a step once you export it to Excel. Don't know what I'm talking about? Check the following video:

https://www.hahn-tech.com/thinkorswim-rtd-excel/


Marked as spam
Posted by (Questions: 37, Answers: 4090)
Answered on September 2, 2020 8:55 pm
0
Got it. This is the only way to go about it, correct? My method involves backtracking many tickers on specific dates and loading a chart on those dates to give me values for what it was then. Doubt I would be able to do that here. If that's the only way right now, then that's good to know. Thanks!
( at September 2, 2020 10:52 pm)
0
Well as I understand what you just stated, this can only to accomplished if you employ the OnDemand feature. The chart labels will also display the data as it is on the last bar of the chart. There is no direct or simple way to get those chart labels to display data from specific dates. OnDemand is the only option. So if that is what you had planned then you can use the OnDemand feature and any columns you add to a watchlist will display data for whatever date you have selected. If you are trying to construct custom metrics from chart data which can be directly exported to a .CSV file (spreadsheet), then you really need to be using TradeStation for this. This whole thing is supported natively on TradeStation. Just right a custom indicator, apply it to a chart, then export the chart data to a file.
( at September 3, 2020 9:04 am)