Full candle body and wick crossing 50 ema


Category:
0
0

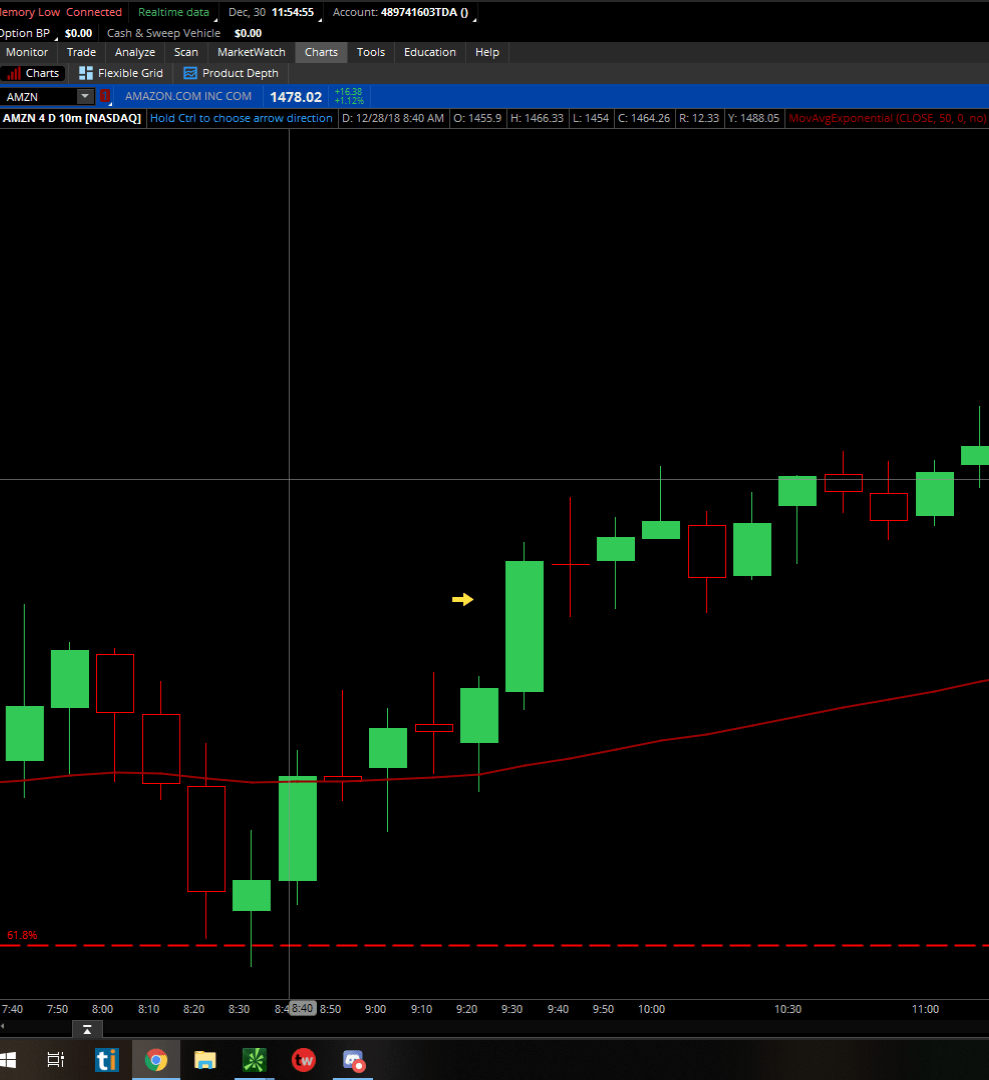
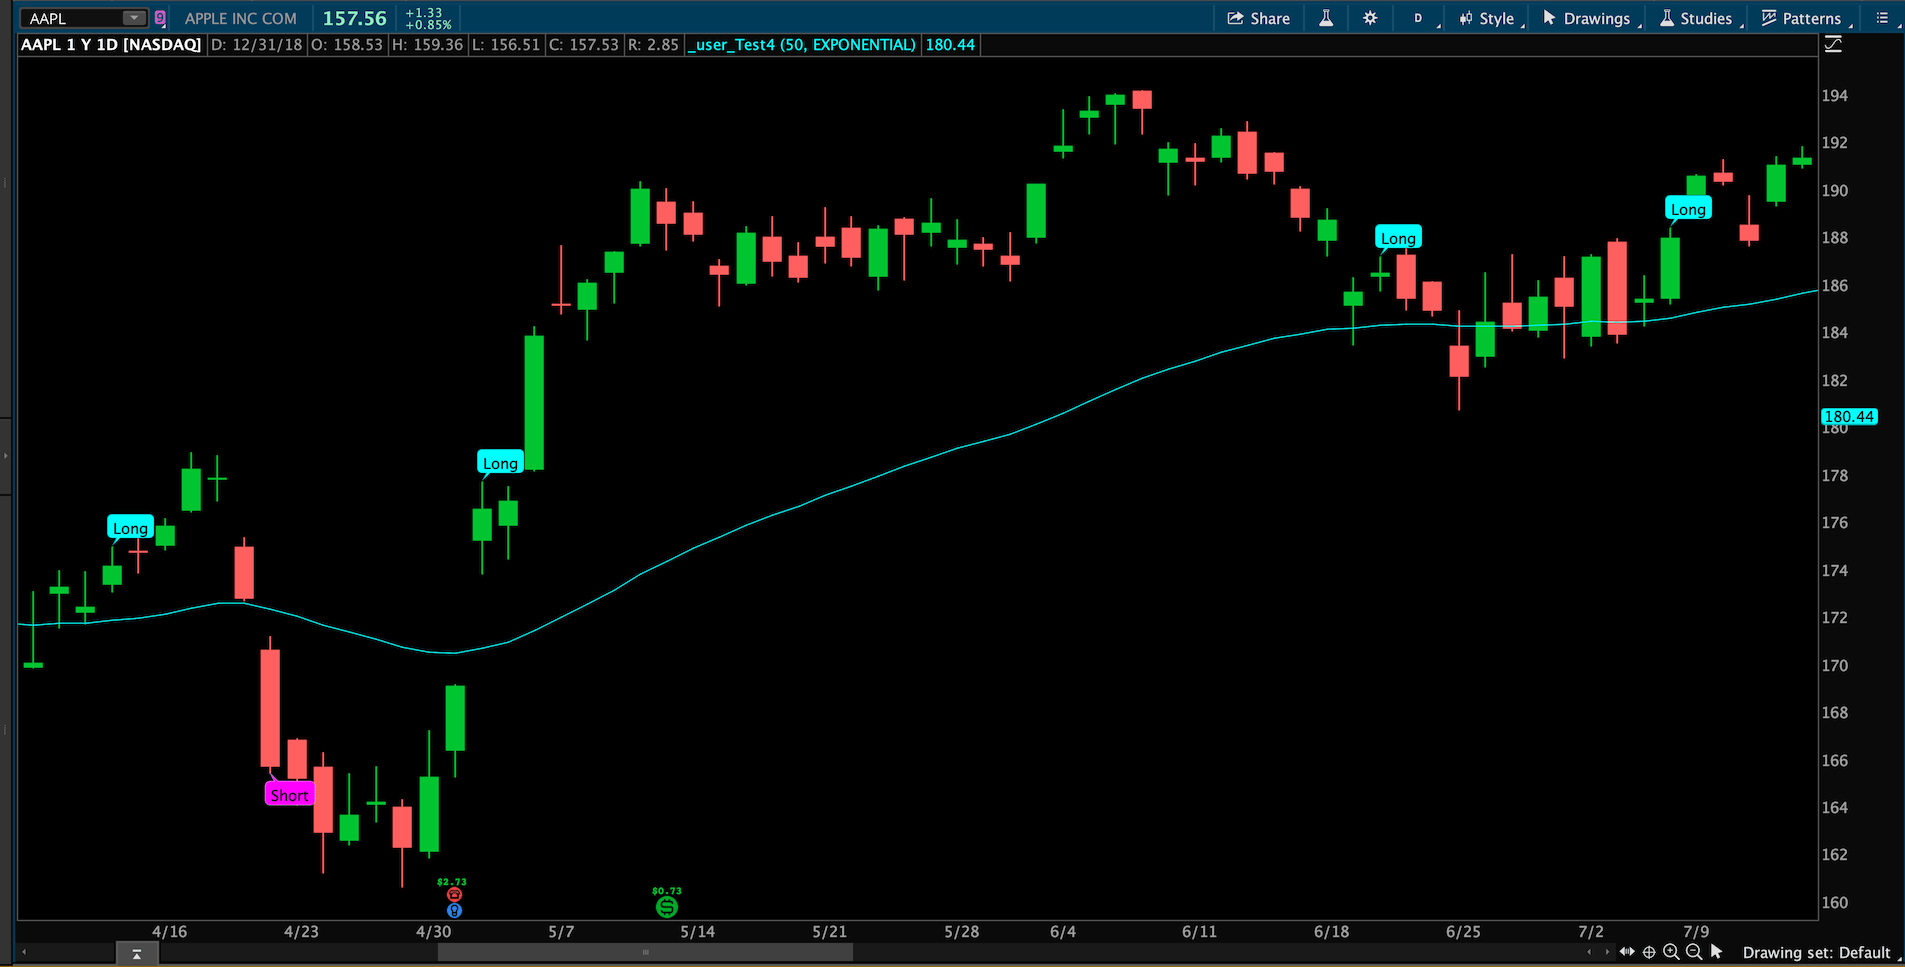
Hey Pete

I decided to rewrite my question since I might have been unclear..LOL..I’m looking for a chart study where the candlestick has completely crossed below or above  and closed on the 50EMA…..Not just crosses it but completely crosses and closed.  Could it plot it after it closes and have the alerts has LONG/SHORT and not arrows…..Below is and example of the candle plot ….Thanks Pal

Attachments:
Marked as spam
Posted by (Questions: 49, Answers: 42)
Asked on December 30, 2018 11:58 am
253 views
0
Private answer

I updated the question title to better reflect the context of your request. This will make is easier for other viewers searching for a similar solution to search for and find your post.

Here is the code. Screenshot below shows the result.

input length = 50;
input averageType = AverageType.EXPONENTIAL;
plot ma = MovingAverage(averageType, close, length);
def fullCandleAbove = low > ma;
def fullCandleBelow = high < ma;
def signalLong = fullCandleAbove[1] and !fullCandleAbove[2];
def signalShort = fullCandleBelow[1] and !fullCandleBelow[2];
AddChartBubble(signalLong[-1], high, "Long", Color.CYAN, yes);
AddChartBubble(signalShort[-1], low, "Short", Color.MAGENTA, no);

Attachments:
Marked as spam
Posted by (Questions: 37, Answers: 4084)
Answered on December 31, 2018 9:42 am