Gaps greater than x percent premarket and regular session


Category:
0
0

I’m struggling trying to develop a premarket scanner than behaves differently during different times of day. The scanner should display the current gap from previous day close to current price during premarket hours, while diverting to a normal gap scanner at all other times, ie. open-close[1]. Here is what I have so far:

<code>

# Premarket Gap Percentage

input marketClose = 1600;
input marketOpen = 0930;
def closeCounter = SecondsTillTime(marketClose);
def openCounter = SecondsTillTime(marketOpen);
def regSessEnd = closeCounter[-1] == 0;
def regSessStart = openCounter[-1] == 0;

rec priorDayClose = if regSessEnd then close else priorDayClose[1];

rec dayOpen = if regSessStart then open else dayOpen[1];

def seconds_market = secondsFromTime(0930);
def market_close = secondsTillTime(1600);
def seconds_pre = secondsFromTime(0400);
def market_open = secondsTillTime(0930);
def isopen=seconds_market>=0 and market_close>=0;
def ispre=seconds_pre>=0 and market_open>0;

def l = if ispre then close else dayOpen;
def c = priorDayClose;

plot x = 100*(l-c)/c > 2;
</code>

This seems to work except that for a lot of the “priorDayClose” prices I’m getting 0.0, which is resulting in an infinite gap. Tons of these are showing up on the scanner with infinite gaps. I’m also using background color (in a quotes script to display the same gap data) to show which period of day (premarket, market, and closed) the current time is in. Under this method, the background color is consistently reflecting that the market is open. Not sure what I can do about this!

Marked as spam
Posted by (Questions: 1, Answers: 1)
Asked on October 21, 2019 7:55 pm
203 views
0

Your question title needs to describe the context. "Robust Premarket Scanner" does not describe the context of your request. You have a custom scan that finds stocks based on premarket and regular session gaps greater than X percent. Your question title should reflect that. Otherwise how are the rest of our viewers going to know what your post is about when searching through a list of over 1,000 posts trying to find a solution? Anyone searching for a custom scan that picks up premarket AND regular session gaps will NEVER find your post.

Let's see what the best question title looks like for this post:

"Gaps greater than x percent premarket and regular session"

I'll go ahead and update that before posting the solution. Doing so will break the original URL link to this post. But it will still appear in your list of posted questions.

( at October 22, 2019 8:56 am)
0
Private answer

I would be remiss if I didn't take the time to explain this code is full of inconsistencies, redundancies and unused items. Please do not take this too harshly. You are obviously here to learn something so I am going to teach. It may feel like I am stepping on some toes. So stand firm.

Debugging the Code

The code is extremely difficult to read. I took 20 minutes to fix everything. It's very important that you reduce everything to the bare minimum so you can properly debug the code. For Thinkorswim, the only debugging tool we have is the chart. So we take your code, fix up the many mistakes and plot it on a chart to find out what exactly is taking place under the hood.

camelCase versus under_score

It's a matter of preference. So use whichever method is easiest for you to read. But do your best to avoid mixing both in the same code. It really slows down the process of reading the code. I have corrected the code to use only camelCase.

Unused Statements

I understand that during development there tends to be several lines of code that end up not being used. When you get results you don't expect the first step is to remove all the lines that don't get used for the final result. During this process, many solutions are found. I have removed all but the most essential lines of code from your example.

Redundancies

There was only one case of this in your code.

def c = priorDayClose;
plot x = 100*(l-c)/c > 2;

But I have corrected it for the debug version.

Excessive Abbreviations

Always avoid using single characters for variable names. You have two options when writing code to make it is easiest to read and maintain. One is to use a comment for every line of code. The other is to use variable names that clearly explain what each variable contains. Lean towards the latter of two but don't hesitate to use comment lines where appropriate.

Spacing Between Mathematic and Logic Operators

Never write any statement like this:

plot x = 100*(l-c)/c > 2;

That is very difficult to read. Instead you should write it this way:

plot value = 100 * (gapPrice - priorDayClose) / priorDayClose > 2;

Plotting on a Chart to Troubleshoot the Code

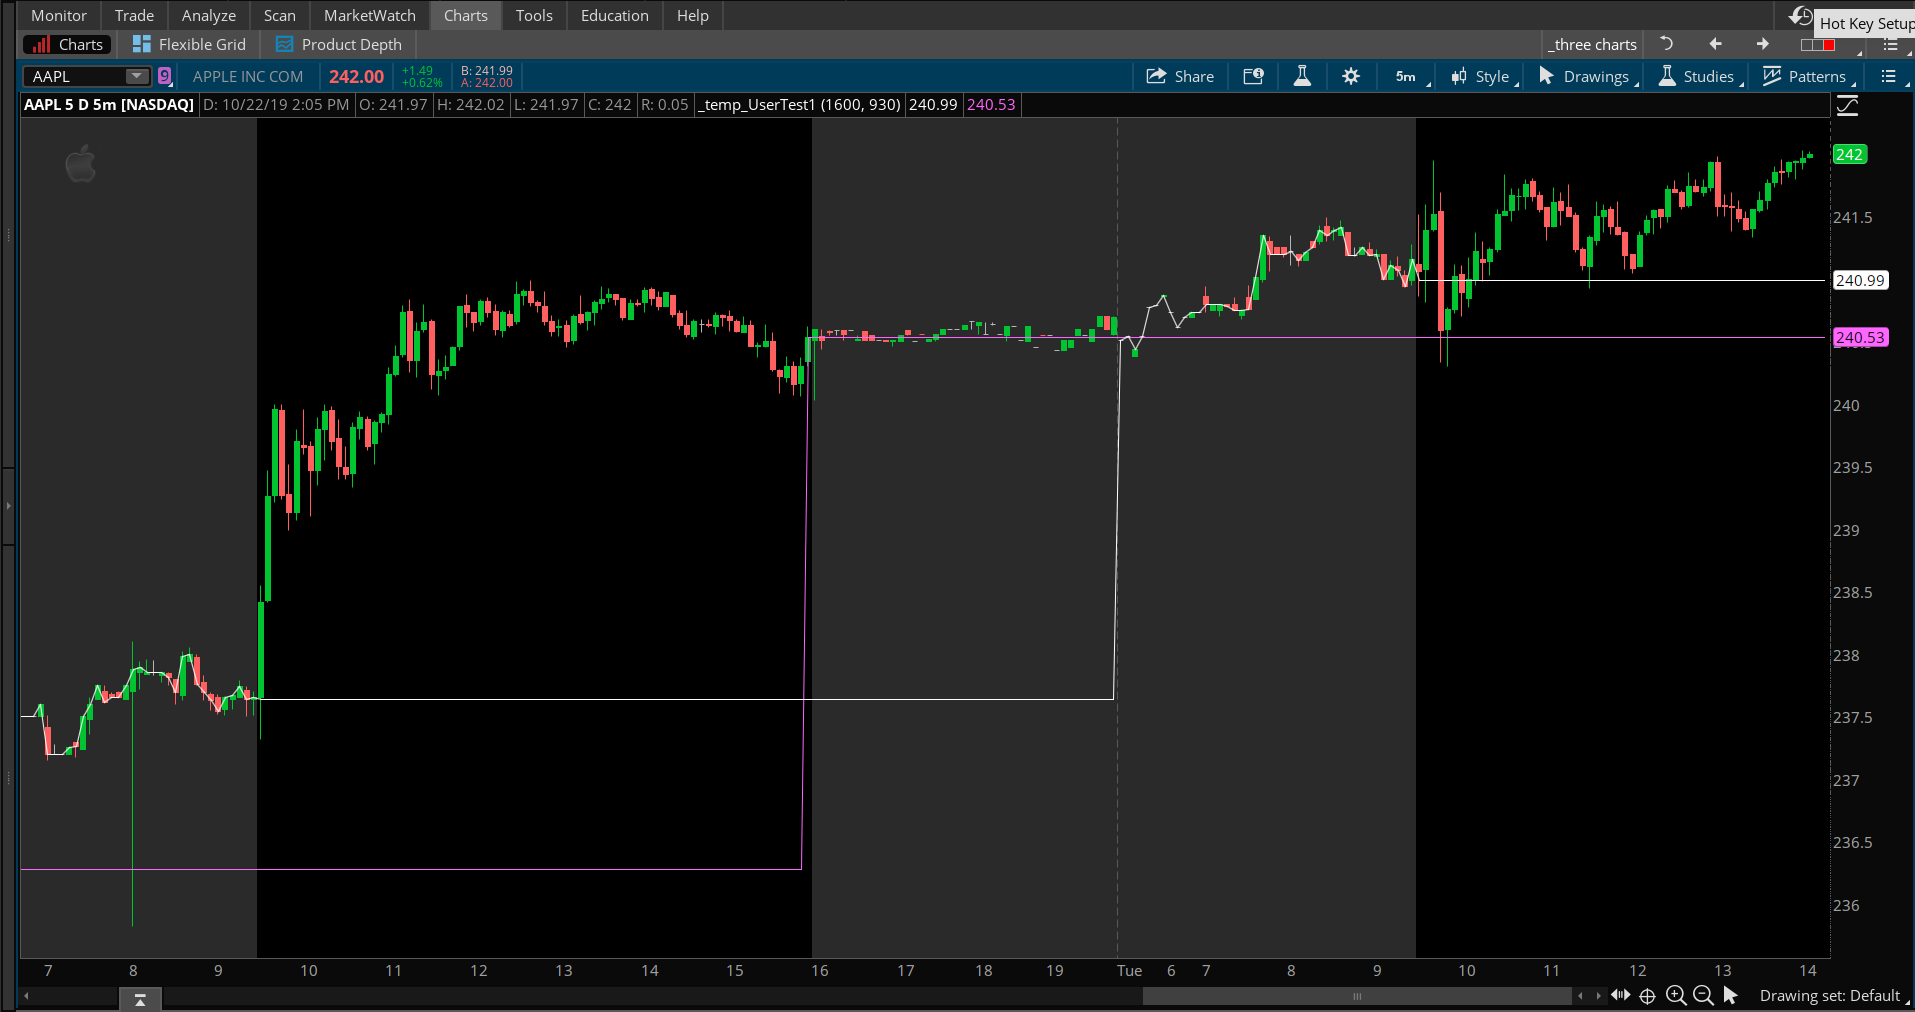
Once I have corrected all these bits and pieces I can now add this to a new chart study and plot two of your most important variables so we can see what it looks like:

input marketClose = 1600;
input marketOpen = 930;
def closeCounter = SecondsTillTime(marketClose);
def openCounter = SecondsTillTime(marketOpen);
def regSessEnd = closeCounter[-1] == 0;
def regSessStart = openCounter[-1] == 0;
rec priorDayClose = if regSessEnd then close else priorDayClose[1];
rec dayOpen = if regSessStart then open else dayOpen[1];
def secondsPre = SecondsFromTime(0400);
def isPre = secondsPre >= 0 and openCounter > 0;
plot gapPrice = if isPre then close else dayOpen;
plot test1 = priorDayClose;
#plot value = 100 * (gapPrice - priorDayClose) / priorDayClose > 2;

Screenshot below shows the result. Now that you have a debug version of your scan you can go through your list of stocks and plot them. You should soon identify exactly what is causing the unexpected results. (you will likely find the errors are due to stocks that have little or no trade data for the extended hours session)

Attachments:
Marked as spam
Posted by (Questions: 37, Answers: 4087)
Answered on October 22, 2019 11:12 am
0
Pete, I appreciate your help with this language! I'm a Python man, still getting grips with what TOS has to offer. I recently read your answer to another pre-market gap question on this forum. The main problem here is the last candle of trading and/or premarket activity. I'd love the ability to filter these out. Do you think there is a way to determine if it is using a candle from more than one close ago? If this is not the proper way to ask the question - please let me know and I'll do my best to post a question elsewhere that meets the standards for your community!(: I appreciate this forum and the help that you are providing!
( at December 18, 2019 7:18 am)
0
"The main problem here is the last candle of trading and/or premarket activity. I'd love the ability to filter these out". I don't understand this at all. "filter these out"? The "last candle of trading" is your daily close. And "the last candle of premarket" is where the code reverts to a "normal" gap scanner. This seems to me to behave exactly as you requested.
( at December 18, 2019 7:56 am)
0
Let me rephrase - I'd like to filter out stocks where there is either a) no candle at market close, b) no pre/aftermarket trading. I'll go further to say "Because the problem seems to be that the scanner pulls the previous day's close when there is no closing candle available - I'd like to determine a method to 'filter this eventuality.'" Right now the scan is pumped full of tickers that fall under either of the two conditions above.
( at December 19, 2019 7:22 am)
0
Ok, I understand that clearly. Thanks for rephrasing it. Without seeing the exact code you are using for the scan I don't have a firm solution. In my answer I merely provided a chart study used to troubleshoot the issues you were having. I have no way of knowing how or which elements from my chart study you have incorporated into your scan. What I do for all my scans is apply a top level filter that removes the majority of junk. If you do not apply a top level filter, or select "All Stocks" for the top level filter then you will include endless amounts of OTC stocks. So rather than trying to address this by writing more code I suggest you first seek to employ the easiest and most efficient solution, which is to apply a top level filter which ensures you are scanning the universe of stocks which have full days of trading activity and plenty of after hours trading activity. As a side benefit, your scans will run much faster.
( at December 19, 2019 8:30 am)