| ♥ 0 |
Hello Mr. Hahn, This is a conceptual question about a TOS study. I know how to get yesterdays low, close, high etc. However, I’d like a study to be able to grab the barnumber of those points/candles and then grab the open or close of that candle body as well. This is to be able to draw a box automatically for the last couple of days that ranges from example: bottom of LOW candle of day to the bottom of the candle body. I’d want to do that for the high, close as well. This is to auto draw those clouds/boxes and then in the study perform alerts/warnings/arrows etc. when the price reaches close to those areas or within to mitigate them. Can you point me in the right direction code wise to grab the above barnumbers? If so, I can take it from there. Thank You In Advance!
Marked as spam
Asked on March 17, 2023 8:44 am
717 views
|
|
Private answer
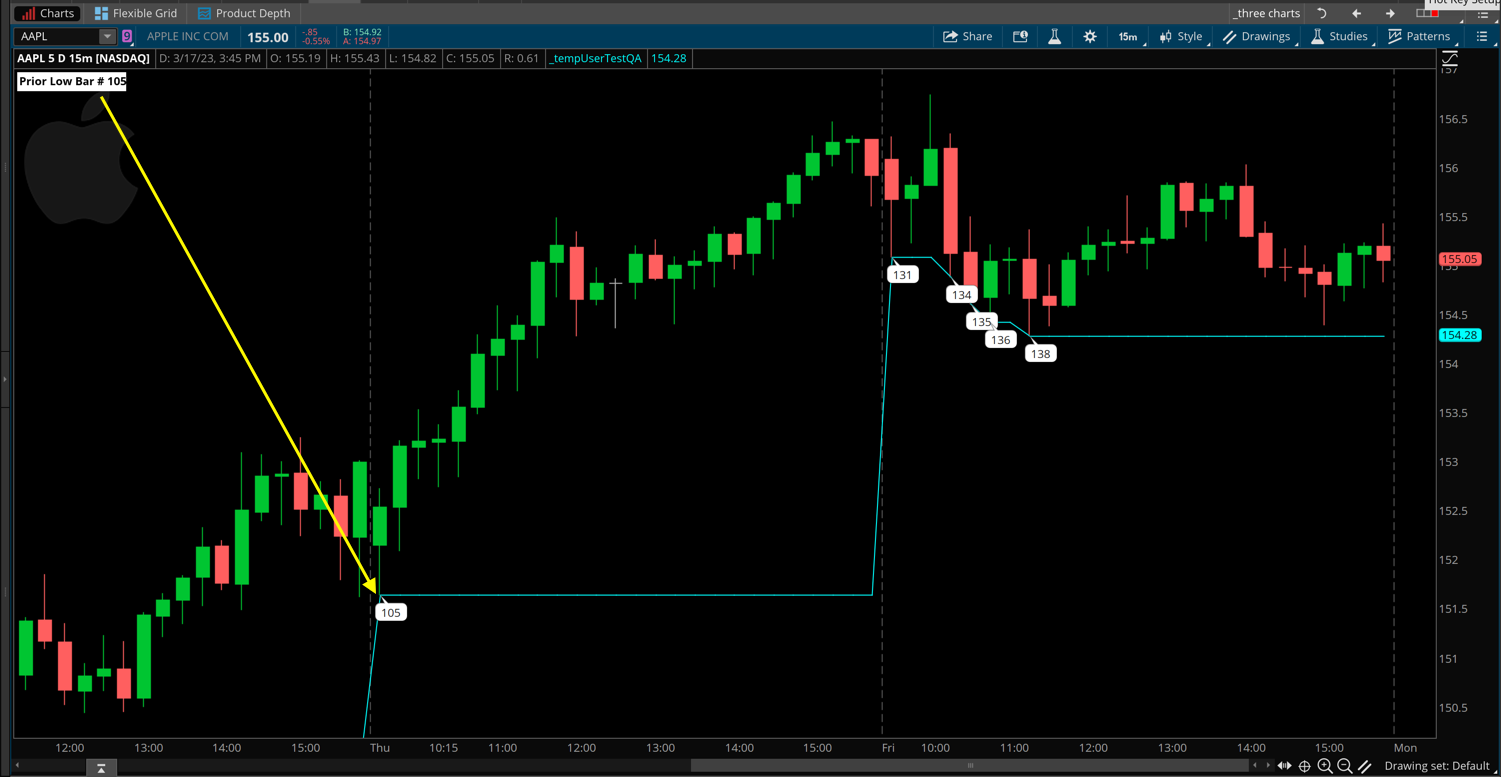
I very rarely use the bar number for any of my custom projects on Thinkorswim. I really don't have a use for it. I track conditions and values directly. And if I want to keep track of how many bars between conditions I create variables which count those bars. However one of the things I use very frequently is tracking the lowest low and highest high and carrying those values over into the next trading session. So I can very quickly adapt those techniques to also capture and display the bar number. For those looking for a detailed explanation on the BarNumber() function you can view the following resource from Thinkorswim: https://toslc.thinkorswim.com/center/reference/thinkScript/Functions/Others/BarNumber The following code displays the lowest low as it forms across the trading session. And you did not mention you intended to use this on an intraday time frame but based on the rest of your details I believe that is what you intended. The following code also displays the bar number at each candle which forms a new session low. The label in the upper left corner displays the bar number for the last lowest low of the previous session.
I have included a screenshot below showing how this plots on a chart. Notice that extended hours are NOT included on this chart. If you were to include extended hours on the chart then the code would also use that data in computing it's values. Attachments:
Marked as spam
Answered on March 17, 2023 1:46 pm
|