There are two methods you can employ to accomplish this.
The hard way:
You must create the filter criteria, then apply that to show/hide all the various elements included in the chart study.
The easy way:
Use the Assert() statement to force the chart study to throw an exception and alert the user the incorrect aggregation period has been applied to the chart.
Both solutions begin with the filter criteria which checks the current aggregation period applied to the chart and returns a value of true when the correct aggregation periods have been applied to the chart and false for everything else.
def correctAggregationPeriods = GetAggregationPeriod() == AggregationPeriod.THREE_MIN or GetAggregationPeriod() == AggregationPeriod.FIVE_MIN;
For the easy way, you then use that filter criteria in the Assert() statement as follows:
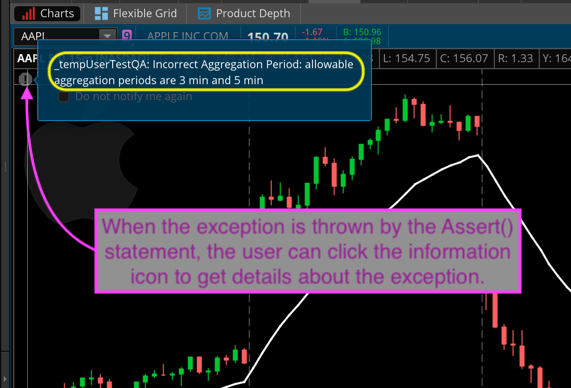
Assert(correctAggregationPeriods, "Incorrect Aggregation Period: allowable aggregation periods are 3 min and 5 min");
Screenshot below shows where the exception message appears on the chart when the incorrect aggregation period has been applied to the chart.
For the hard way, you would need to take that variable which checks for valid time frames (correctAggregationPeriods) and apply it to every element in the chart study. That includes AddLabel(), AddCloud(), AddChartBubble(), AddVerticalLine() and plot statements. I don't have time to build a solution which includes all of those examples so I'll leave that to you to work out.