Highlight Row percent change on the day is > x


Category:
0
0

Hello,

I wanted to know if you could help me create a study that highlights rows in scanner/watchlist

IF: the %change on the day is greater THEN: 30% highlight row to yellow

Marked as spam
Posted by (Questions: 6, Answers: 4)
Asked on June 18, 2020 5:26 am
56 views
0
IF: the %change on the day is greater THAN > 30% THEN: highlight the watchlist row YELLOW
( at June 18, 2020 5:31 am)
0
Private answer

This depends on how you compute the "percent change on the day".

  1. The built in column that displays percent change is based on the previous bar's close to the current price.
  2. Some might describe "percent change on the day" as the percent change from today's open to the current price.

Here is the code for the first scenario:

input percentThreshold = 30.0;
plot percentChange = if close[1] > 0 then 100 * (close / close[1] - 1) else 0;
percentChange.AssignValueColor(if percentChange > percentThreshold then Color.BLACK else Color.CURRENT);
AssignBackgroundColor(if percentChange > percentThreshold then Color.YELLOW else Color.CURRENT);

And here is the code for the second scenario:

input percentThreshold = 30.0;
plot percentChange = if open > 0 then 100 * (close / open - 1) else 0;
percentChange.AssignValueColor(if percentChange > percentThreshold then Color.BLACK else Color.CURRENT);
AssignBackgroundColor(if percentChange > percentThreshold then Color.YELLOW else Color.CURRENT);

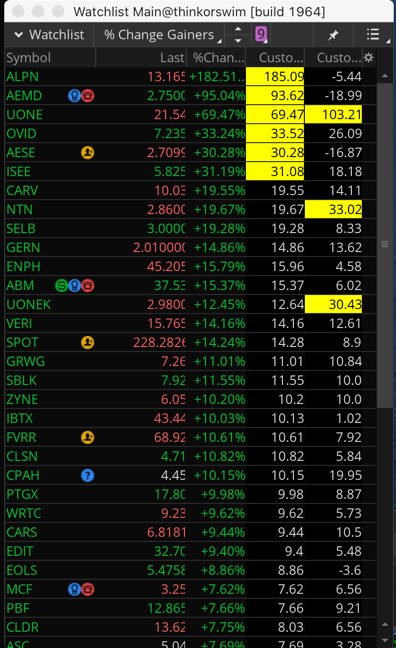
Both of those are applied to a daily time frame to compute the values for the current trading day.

Screenshot below shows the result.

Attachments:
Marked as spam
Posted by (Questions: 37, Answers: 4087)
Answered on June 18, 2020 10:27 am
0
Thanks for the solution but can you include the percent sign (%) next to the numbers. I appreciate that
( at June 18, 2020 7:36 pm)
0
There are issues with doing that. You will not be able to properly sort buy that column if you do this. It requires that you replace the plot statement with an AddLabel statement. What happens then is the value gets converted to text (which is why it fails to sort properly). There are examples of this elsewhere in the form, you can search for the term "AsPercent" to locate them. Here is a link to the language reference in Thinkorswim describing how to use this method: https://tlc.thinkorswim.com/center/reference/thinkScript/Functions/Others/AsPercent
( at June 18, 2020 8:10 pm)