I spent WAY to much time on this. But you have been very consistent in providing voluntary contributions each time you post a new request. So I decided to stick with it until it was complete. And let me tell you for most of those 2+ hours I was pretty sure I would not be able to figure this out.
I am providing a compressed version of the code here, because it takes up 55 lines. If you want the the uncompressed version I am attaching the STUDY.ts file, (the very tiny link right above the first screenshot below).
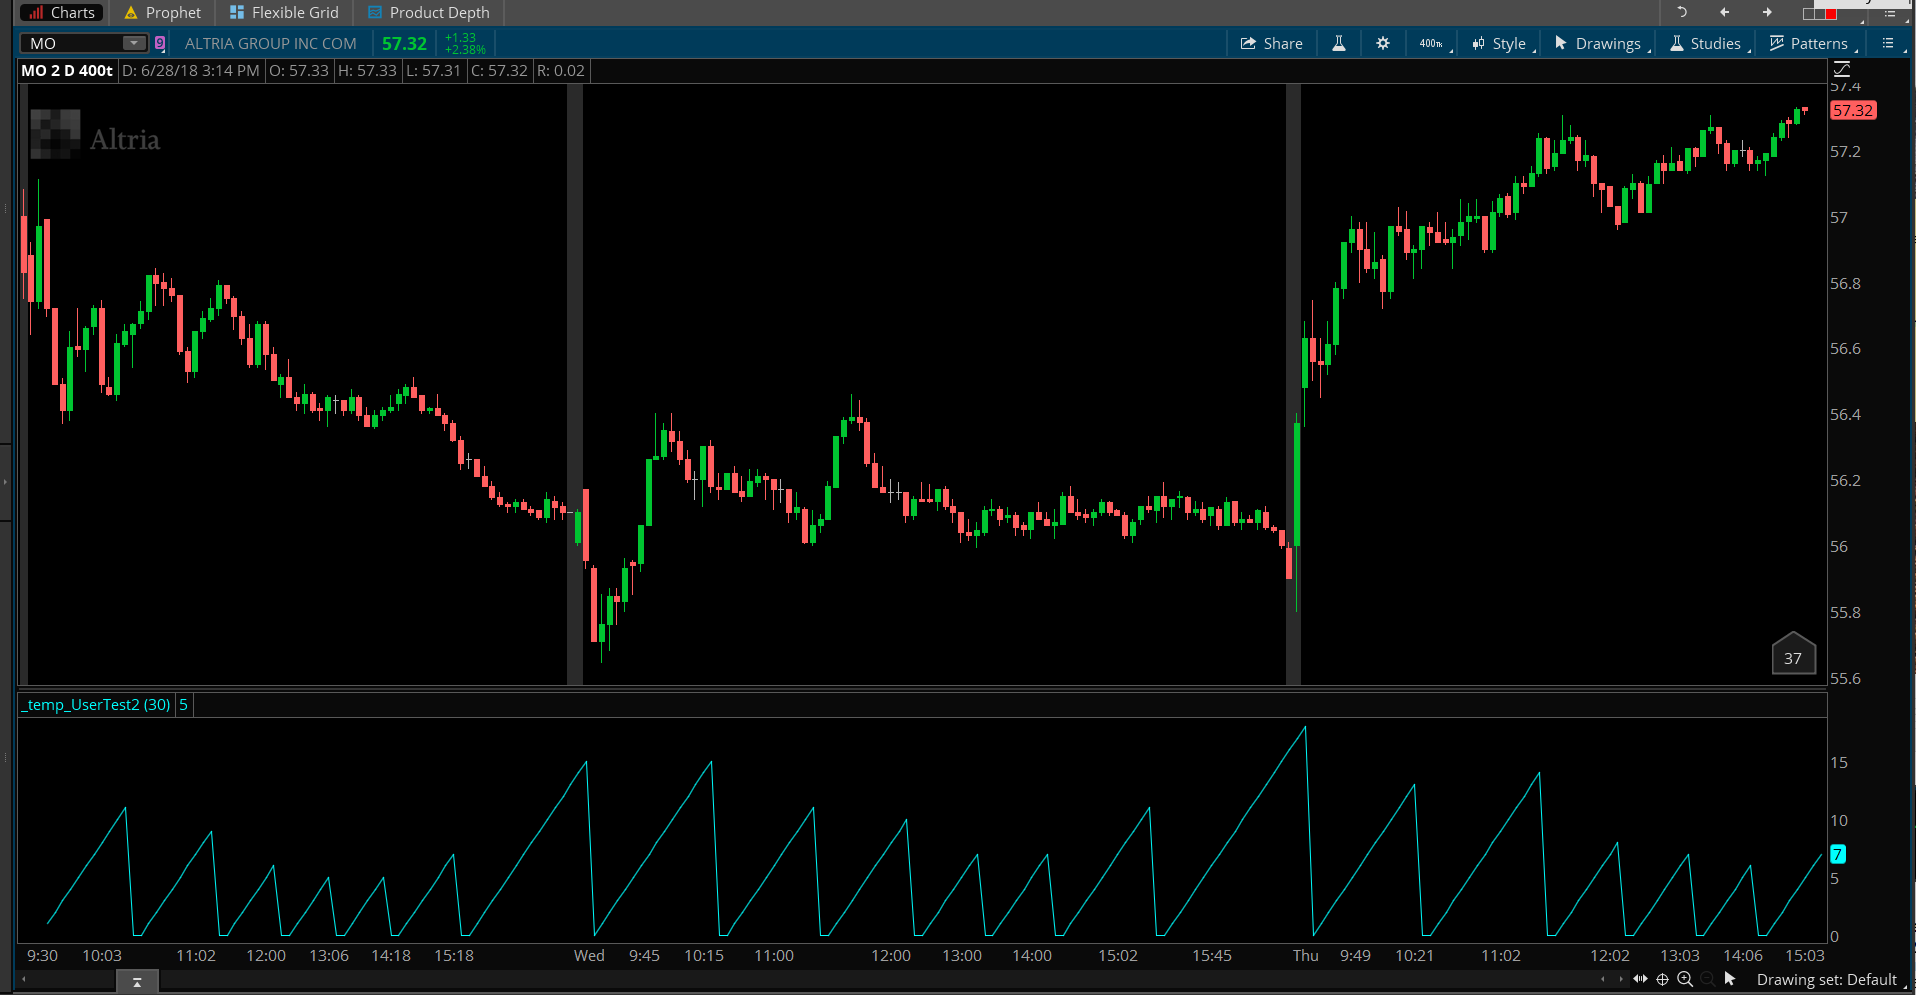
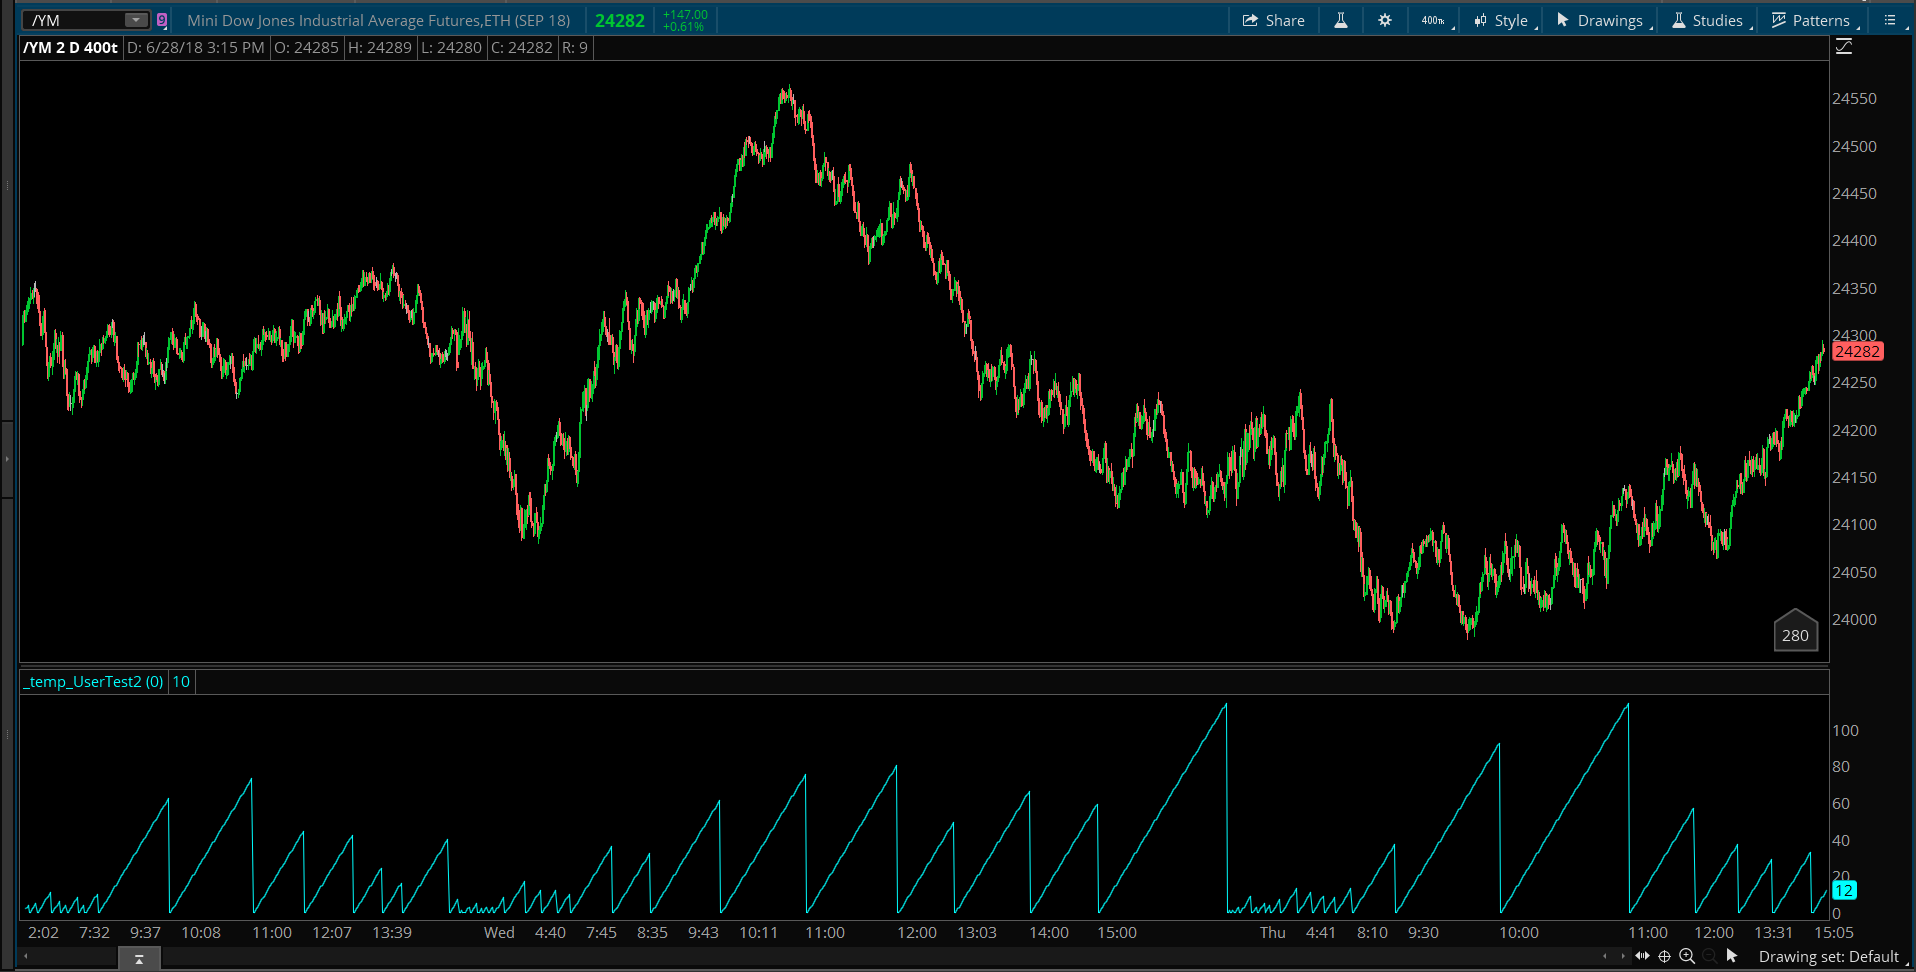
Important note for settings! For Futures and Forex, you will set the chart to plot the full session and set the user input named “time” to 0. For Stocks, you will set the chart to include extended hours and set the user input named “time” to 30. View the attached screenshots for examples of each setting.
This had to be done using brute-force tactics. There are a few missing elements in the thinkscript language that prevent a more elegant code solution. Such as would be accomplished in some other platform.
Here is the compressed code:
declare lower;

input timeStart = 0;

def time1 = timeStart + 100; def time2 = time1 + 100; def time3 = time2 + 100; def time4 = time3 + 100; def time5 = time4 + 100; def time6 = time5 + 100; def time7 = time6 + 100; def time8 = time7 + 100; def time9 = time8 + 100; def time10 = time9 + 100; def time11 = time10 + 100; def time12 = time11 + 100; def time13 = time12 + 100; def time14 = time13 + 100; def time15 = time14 + 100; def time16 = time15 + 100; def time17 = time16 + 100; def time18 = time17 + 100; def time19 = time18 + 100; def time20 = time19 + 100; def time21 = time20 + 100; def time22 = time21 + 100; def time23 = time22 + 100; def hourStart = SecondsFromTime(timeStart) > 0 and SecondsFromTime(timeStart)[2] < 0; def hour1 = SecondsFromTime(time1) > 0 and SecondsFromTime(time1)[2] < 0; def hour2 = SecondsFromTime(time2) > 0 and SecondsFromTime(time2)[2] < 0; def hour3 = SecondsFromTime(time3) > 0 and SecondsFromTime(time3)[2] < 0; def hour4 = SecondsFromTime(time4) > 0 and SecondsFromTime(time4)[2] < 0; def hour5 = SecondsFromTime(time5) > 0 and SecondsFromTime(time5)[2] < 0; def hour6 = SecondsFromTime(time6) > 0 and SecondsFromTime(time6)[2] < 0; def hour7 = SecondsFromTime(time7) > 0 and SecondsFromTime(time7)[2] < 0; def hour8 = SecondsFromTime(time8) > 0 and SecondsFromTime(time8)[2] < 0; def hour9 = SecondsFromTime(time9) > 0 and SecondsFromTime(time9)[2] < 0; def hour10 = SecondsFromTime(time10) > 0 and SecondsFromTime(time10)[2] < 0; def hour11 = SecondsFromTime(time11) > 0 and SecondsFromTime(time11)[2] < 0; def hour12 = SecondsFromTime(time12) > 0 and SecondsFromTime(time12)[2] < 0; def hour13 = SecondsFromTime(time13) > 0 and SecondsFromTime(time13)[2] < 0; def hour14 = SecondsFromTime(time14) > 0 and SecondsFromTime(time14)[2] < 0; def hour15 = SecondsFromTime(time15) > 0 and SecondsFromTime(time15)[2] < 0; def hour16 = SecondsFromTime(time16) > 0 and SecondsFromTime(time16)[2] < 0; def hour17 = SecondsFromTime(time17) > 0 and SecondsFromTime(time17)[2] < 0; def hour18 = SecondsFromTime(time18) > 0 and SecondsFromTime(time18)[2] < 0; def hour19 = SecondsFromTime(time19) > 0 and SecondsFromTime(time19)[2] < 0; def hour20 = SecondsFromTime(time20) > 0 and SecondsFromTime(time20)[2] < 0; def hour21 = SecondsFromTime(time21) > 0 and SecondsFromTime(time21)[2] < 0; def hour22 = SecondsFromTime(time22) > 0 and SecondsFromTime(time22)[2] < 0; def hour23 = SecondsFromTime(time23) > 0 and SecondsFromTime(time23)[2] < 0;

def markHours = hourStart or hour1 or hour2 or hour3 or hour4 or hour5 or

hour6 or hour7 or hour8 or hour9 or hour10 or hour11 or hour12 or

hour13 or hour14 or hour15 or hour16 or hour17 or hour18 or hour19 or

hour20 or hour21 or hour22 or hour23;

rec countBars = if markHours then 0 else countBars[1] + 1;

plot numberOfBarsInHour = countBars;
What is your desired metric to plot? Is it time within given bars or is it bars within given time?
For example if its bars within a given time, we need to know the fixed amount of time to use. Is it one hour, given your example of “14:00 to 15:00”? Or 30 minutes, given your example of “15:00 to 15:30”?
Or if you want to plot time within a given number of bars, did you want to use 100 bars and display the amount of time that has elapsed between them? Or did you want to use 50 bars and display the amount of time that has elapsed between them?
As if that was not complex enough I have another question. If bars with a given time, do you want to plot these values on a rolling timestamp? So for any given bar we always look back that fixed amount of time for the count? Or did you want to total up the bars for each significant mark on the clock? Say every 15 minutes, 30 minutes or hour?
Likewise if you select to plot time within a given number of bars. We can do this as a rolling value or we can plot a value every X number of bars.
If it helps to explain things. This post shows how to display time for a given number bars. Except that the number of bars is fixed at 1. https://www.hahn-tech.com/ans/bar-timer-for-tick-charts/
Quick reminder that we are still waiting for you to provide additional details before we can provide an answer to this post.
I want to plot how many 400 tick bars over an hour a value every hour