I will not try to fix the code you have presented as the example because it does not perform the steps in the way I would do them.
I expect that for a majority of viewers coming across this post, they would prefer the point to be attached to either the high or low of the target bar. So my solution has been adapted to fit the use case that will serve the broadest possible audience.
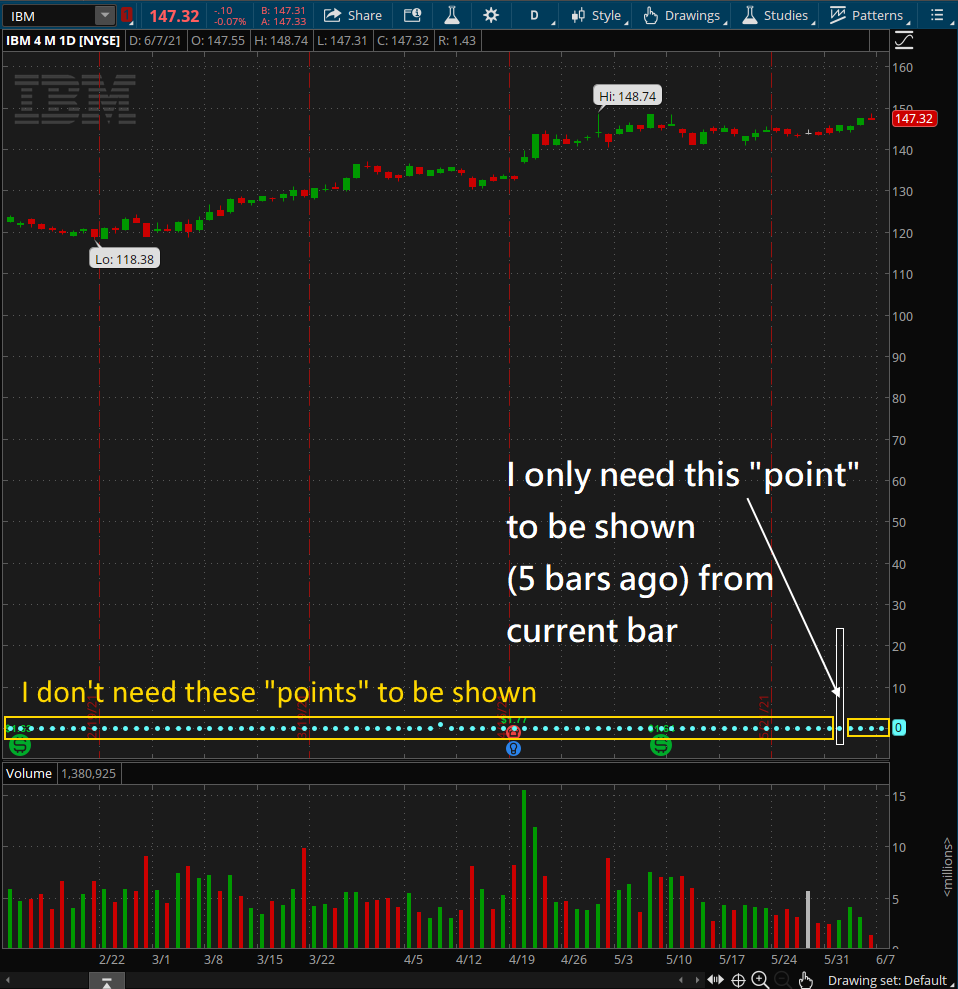
Here is my interpretation of your request. "Plot a single point at the high of the bar that is 5 bars back from the current bar on the chart"
In your screenshot I see that you have created a boolean variable that plots values of 1 or zero. The reason those appear at the very bottom of your chart is due to a chart setting named "Fit studies". This setting forces the price range to automatically adjust to display all the plots of the study. This usually interferes with the way the price candles are displayed so I always turn that setting off. We can avoid this issue by making sure the values we plot are attached to one of the four data points of each candle: Open, High, Low or Close. Then for any bar we do not want the plot to appear we assign it a value of Double.NaN.
Here is my solution. I have included a user input to allow the user to adjust the number of bars ago in which the dot will be placed. I have also included a second user input to allow the user to adjust the data point used to anchor the plot to the candle.
input barsAgoTarget = 5;

input priceTarget = high;

def lastBar = !IsNaN(close) and IsNaN(close[-1]);

plot oneDot = if lastBar[-barsAgoTarget] then priceTarget else Double.NaN;

oneDot.SetPaintingStrategy(PaintingStrategy.POINTS);

oneDot.SetDefaultColor(Color.CYAN);