How to display RSI, MACD chart label


Category:
0
0

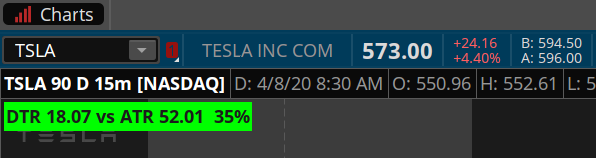
Hello Hahn,

How are you? I was wondering if it’s possible to create a study that displays the current 1) RSI amount and 2) MACD – Green or Red on the top left of the chart screen and will these values update accordingly throughout the day? I have included a snippet of a custom ATR for your reference.

Attachments:
Marked as spam
Posted by (Questions: 9, Answers: 4)
Asked on April 11, 2020 8:13 am
184 views
1
Private answer

AddLabel(yes, Concat("RSI: ", RSI()."RSI"), if MACD()."Diff" is greater than 0 then Color.GREEN else Color.RED);

The RSI value is displayed and the color of the label is set based on the Histogram of the MACD being above or below the zero line.

Marked as spam
Posted by (Questions: 37, Answers: 4087)
Answered on April 11, 2020 9:03 am
0
Wow incredible! This is way better than what I had envisioned. Thank you so much Hanh!
( at April 11, 2020 11:17 am)
0
Hello Hanh, I have a follow up question, is it possible to display the RSI/MACD indicator that you created for a specific time frame? For example, I want to be in a different time frame say 5 minutes and display the 1 Hour MACD/RSI color/amount. Thank you for your help!
( at April 11, 2020 12:06 pm)
0
Yes this is possible. However that is far more complex solution and would need to be posted as a new question because this post did not include that detail in the question title or the body of the question.
( at April 11, 2020 12:16 pm)