| ♥ 0 |
Greetings Mr. Hahn, I was attempting to filter your DMI study into scan that searched for stocks in which the D+ crosses the D- for the first time in “x” amount of periods on a daily chart, ideally, I see that when the D+ crosses for the first time the D- in 90 days is when you can anticipate a stock’s major move. I really wish I could figure this out, I attempted having something as a negative value and inputting “lookback period” however my scan did not work. I have attempted creating this scan for hours without any success. Here is your DMI study to see if you could help me out figuring this scanner . input length = 14;
As always I greatly appreciate your help, share the wealth!! Attachments:
Marked as spam
Asked on June 6, 2017 10:38 am
1936 views
|
|
Private answer
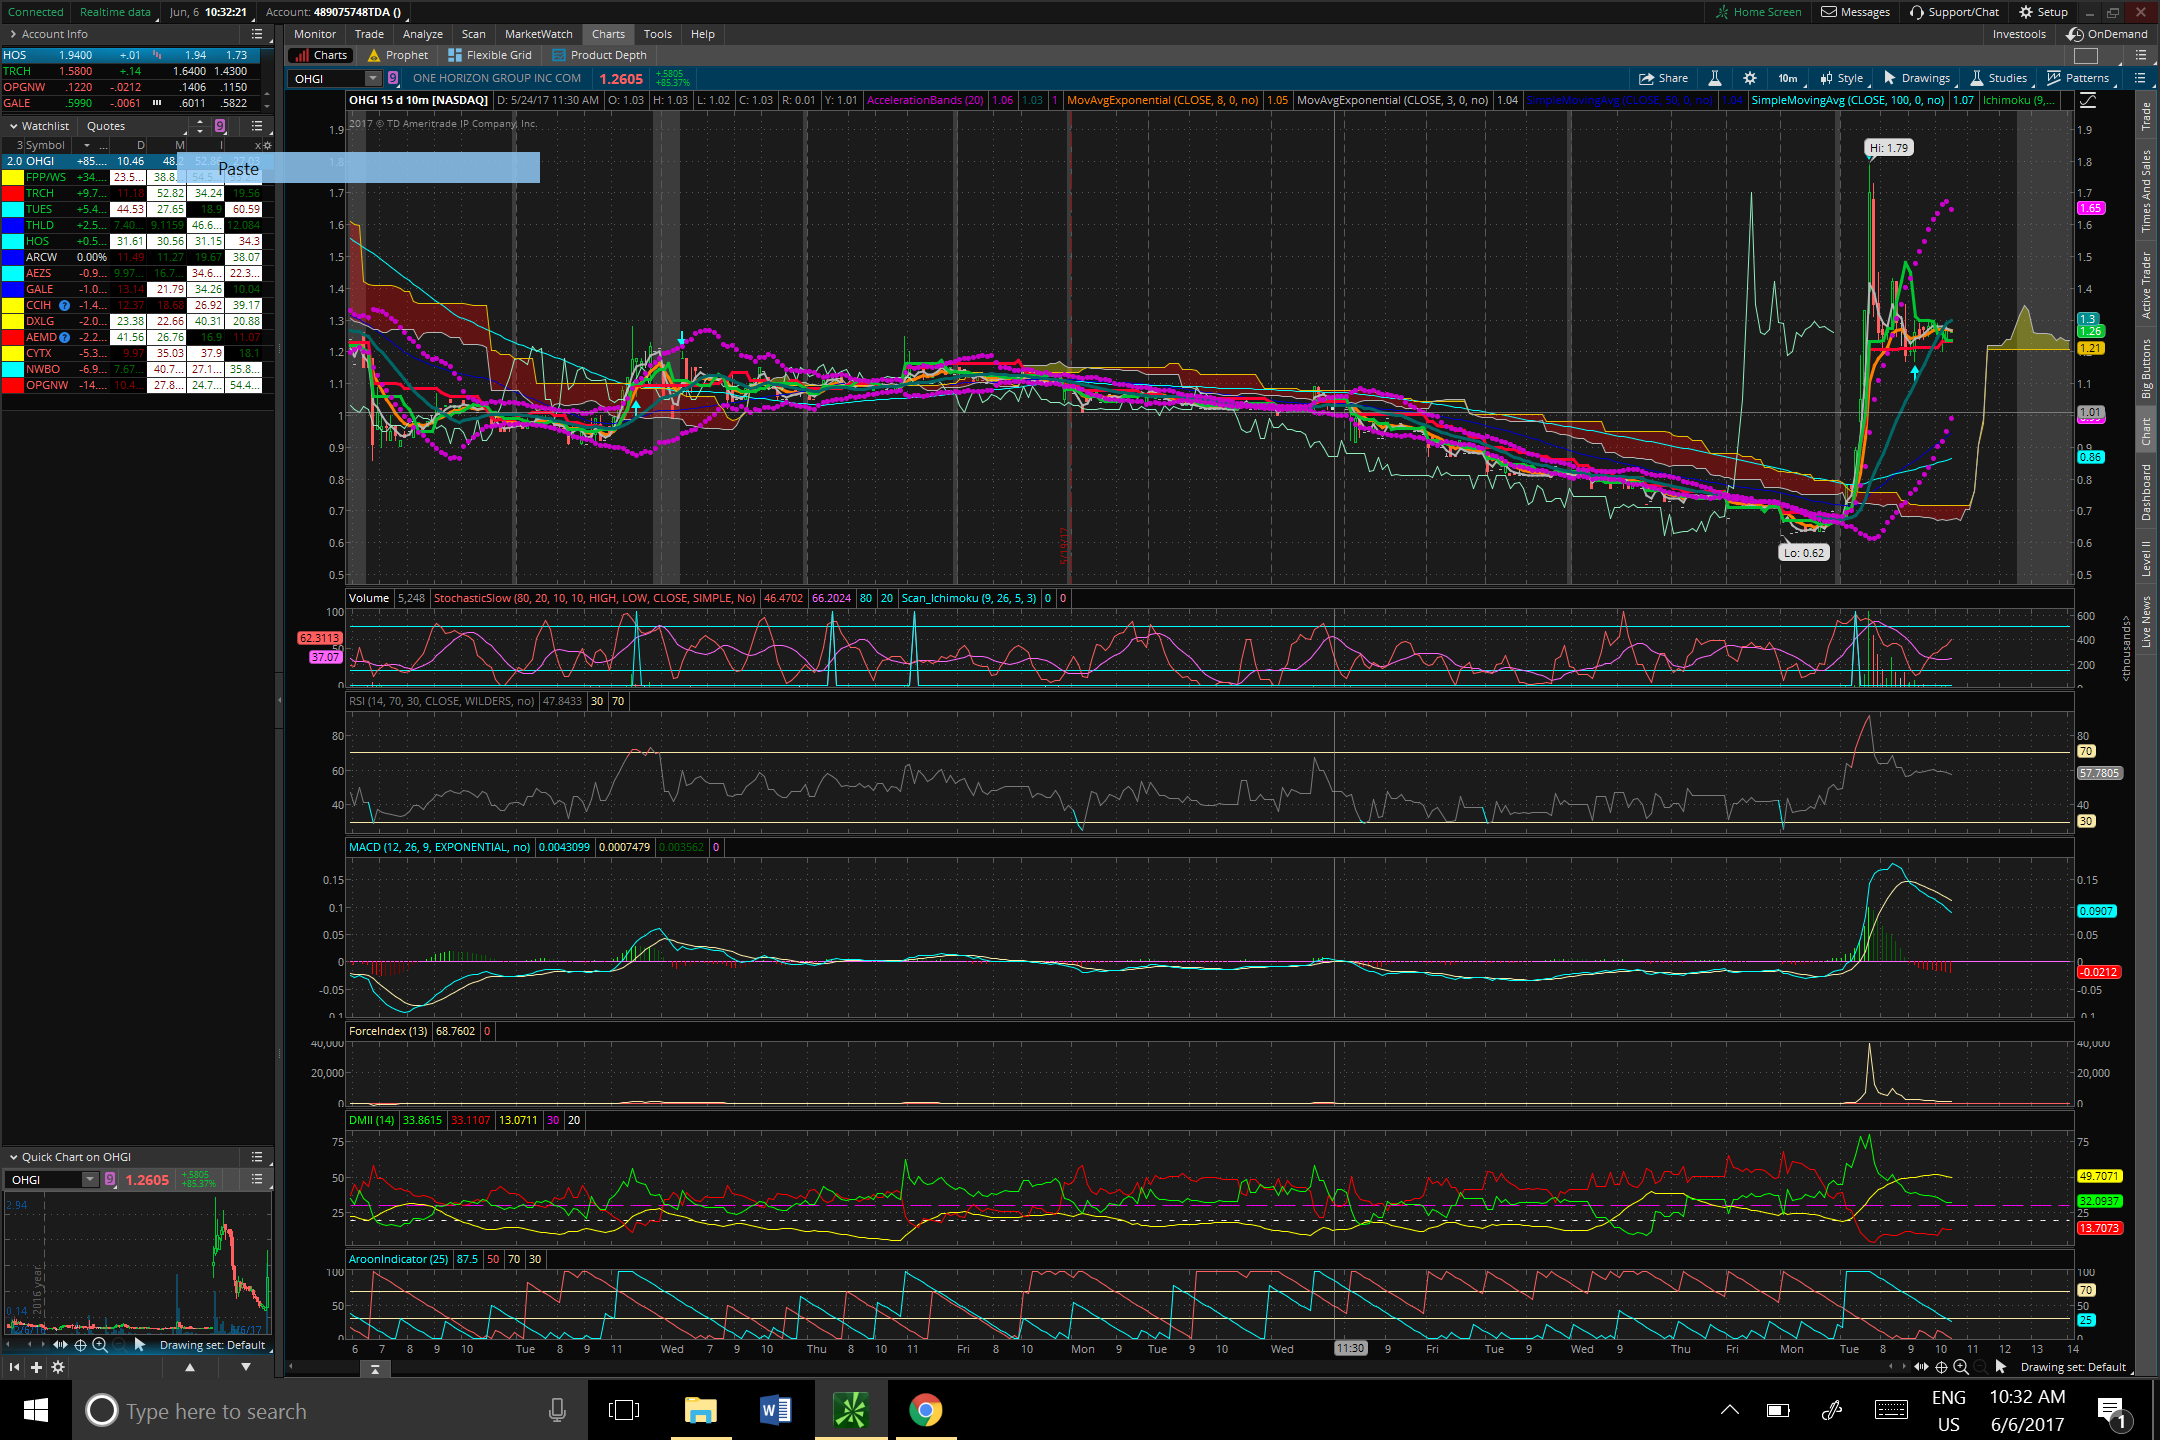
So I see that you have modified your specifications from the original post on this topic. Located here: https://www.hahn-tech.com/ans/scan-dmi-plus-crosses-dmi-minus/ So rather than start with the code you provided in the current post, I will be modifying the code I provide in the solution to your previous post. That code simply scanned for stocks where the DI+ and DI- lines crossed. What I will add here is an additional requirement that the cross is the first to have occurred in the previous X number of bars. Since you suggested a 90 day look back is preferred, I will provide an input for this parameter and set it’s default value to 90. Here is the code, and a screenshot below to show how the signal is being picked up by the scan code.
The ability to check for the presence of a signal X number of bars in the past is very useful. It’s a tool that you should understand how to use. So practice with this and make sure you understand exactly what is taking place in the Plot Scan statements. Attachments:
Marked as spam
Answered on June 6, 2017 12:04 pm
|
|||||||||||||||||||
|
Private answer
Hey, this is a very interesting scanner. However, when I scan I only receive a static number of 90 days. Is there any way this scan could actually search a range of days? For example, if I wanted the scanner to search for a range of 90 to 120 days, would that be possible? It would save time and give me more stock results in a single search rather than searching one by one such as day 90, day 91, day 92, day 93…etc. Thank you! Marked as spam
Answered on June 6, 2017 2:37 pm
|
On the first screenshot second to bottom study, around the center, you can notice how the D+ is always below the D- and barely two days ago the D+ crossed above the D-, and we could have anticipated that major move.
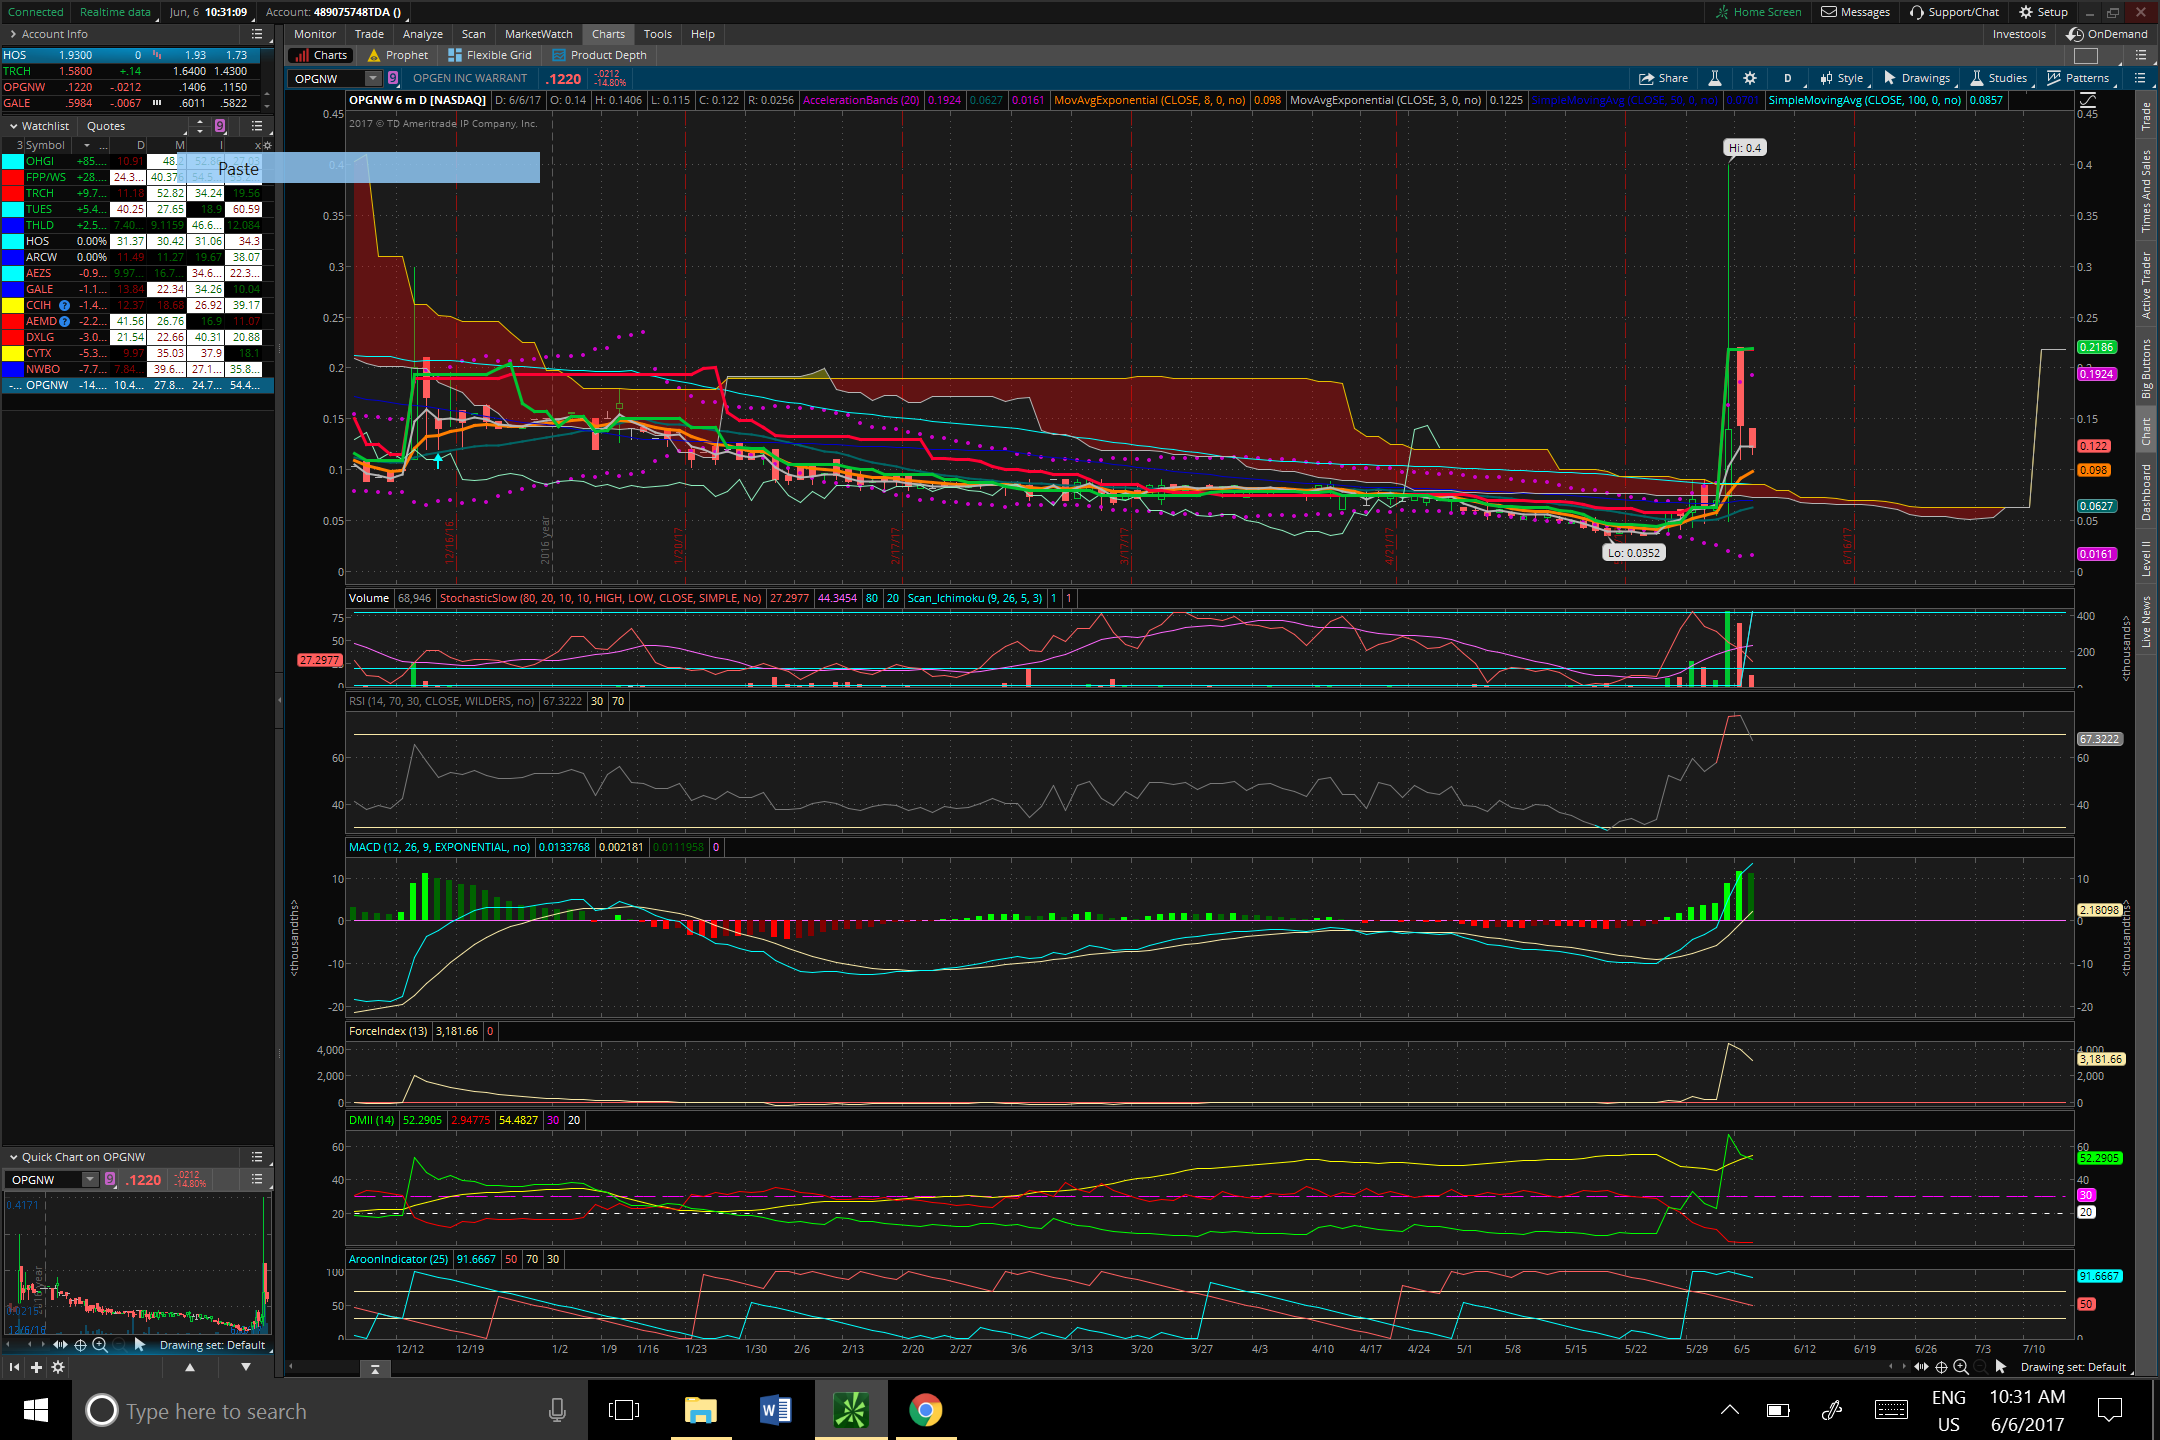
Same thing on the second image, the D+ was below the D- without ever crossing it, and when it did, again, we could have anticipated that move.
I hope we can all benefit from this scanner, as I believe this will be really effective.