How to make a cloud from EMA’s


Category:
0
0

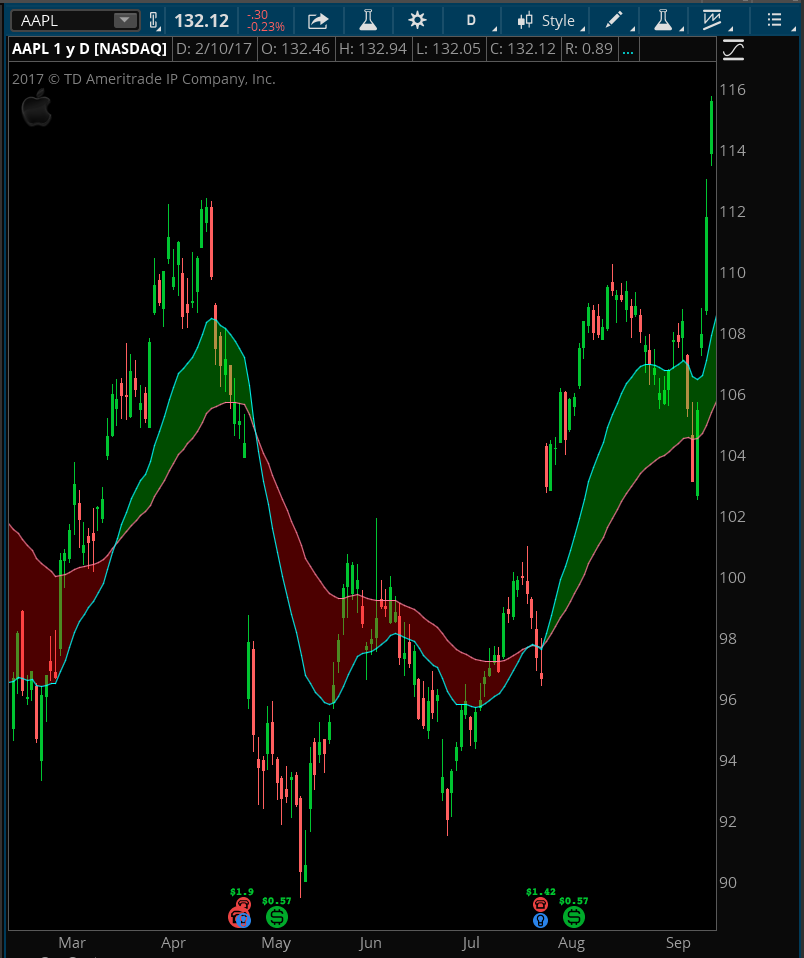
How can I make it so that there is a cloud between the 20 EMA and 50 EMA like the cloud in the Ichimoku cloud? As long as there is a cloud that works. It would be nice if the cloud could be green when the 20 EMA is above the 50 EMA and the cloud is red when the 20 EMA is below the 50 EMA. Thank you!

Marked as spam
Posted by (Questions: 34, Answers: 56)
Asked on February 11, 2017 11:49 am
3576 views
0

Yep, we can do this. Love this question. I’m away from the computer today but will try to post an answer late this evening.

( at February 11, 2017 12:33 pm)
0
Private answer

I think this should do the trick. Here is the code with screenshot attached.

plot ema20 = ExpAverage(close, 20);
plot ema50 = ExpAverage(close, 50);
AddCloud(ema20, ema50, Color.GREEN, Color.RED);

Attachments:
Marked as spam
Posted by (Questions: 37, Answers: 4087)
Answered on February 11, 2017 10:25 pm
0

Thank you brother, is there any way I can scan for stocks with the thickest clouds? Thank you!

( at February 12, 2017 7:30 pm)
0

Consider this. When you try to scan for stocks with the thickest cloud, you merely take the absolute value of the ema20 minus the ema50. This will give you the gap between the two exponential moving averages but will not discriminate between bullish or bearish signals. More importantly, if you create a scan based on the net gap between those two averages, you will be scanning for stocks with the largest per share price. You see that? Because the values of the moving averages will increase as the stock price increases. Another important note. You are essentially measuring the height of the MACD Histogram, if you change the default settings from 12/26/9 to 20/26/9. That make sense? So the only way to get a value that is independent of share price is to take the gap between the two averages and calculate the percentage of that gap to the current share price. So in the context of these details, exactly how do you want to proceed with the specifications for this scan?

( at February 12, 2017 10:13 pm)
0

It’s totally fine if the scan doesn’t discriminate against bullish or bearish signals. I see what you’re talking about, your right… Let’s try and scan for the biggest gaps between the 30 ema and the 50 ema and see what happens.

( at February 13, 2017 3:49 am)
0

Well, in order to scan for the ”biggest gaps”, we need a definition of what a ”biggest gap” looks like. You see the scan is not able to compare the moving average gap size among several stocks. It can only view a single stock at a time. So it does not know that one gap is larger or smaller relative to another stock. So we need to define what a ”biggest gap” looks like and write the code accordingly. This will require some research, scanning manny different charts and measuring the gaps. Then from that you can arrive at a threshold, either a whole number or a percentage. Only then can the scan pick out stocks whose moving average gaps exceed the threshold.

( at February 13, 2017 9:10 am)
0

Makes sense… After researching, I’d say that a 10% and up difference between the 20 EMA and the 50 EMA is a big gap.

( at February 13, 2017 6:05 pm)
0
Private answer

Ok, so in order to build a scan for “Big Gaps” based on the criteria supplied:

def ema20 = ExpAverage(close, 20);
def ema50 = ExpAverage(close, 50);
def emaGap = AbsValue(ema20 - ema50);
def prctDiff = (emaGap / Max(ema20, ema50) * 100);
plot scan = prctDiff >= 10.0;

Marked as spam
Posted by (Questions: 37, Answers: 4087)
Answered on February 13, 2017 7:17 pm
0

Thank you so much! Sorry for this noob question; how would I insert the code above into a scan? I never scanned from a script before.

( at February 13, 2017 8:27 pm)
0

Well, fortunately for you we have an entire category of videos describing how to work with custom scans in Thinkorswim. https://www.hahn-tech.com/category/scans-tos/
Dig in a get up to speed in an afternoon or less.

( at February 13, 2017 9:55 pm)