| ♥ 0 |
Hi Hahn, I found below thinkorswim script on website. — input price = close; Def difference = average(data = price[1], length = Longer_Time) – average(data = price[1], length = Shorter_Time); plot timer=price[1];
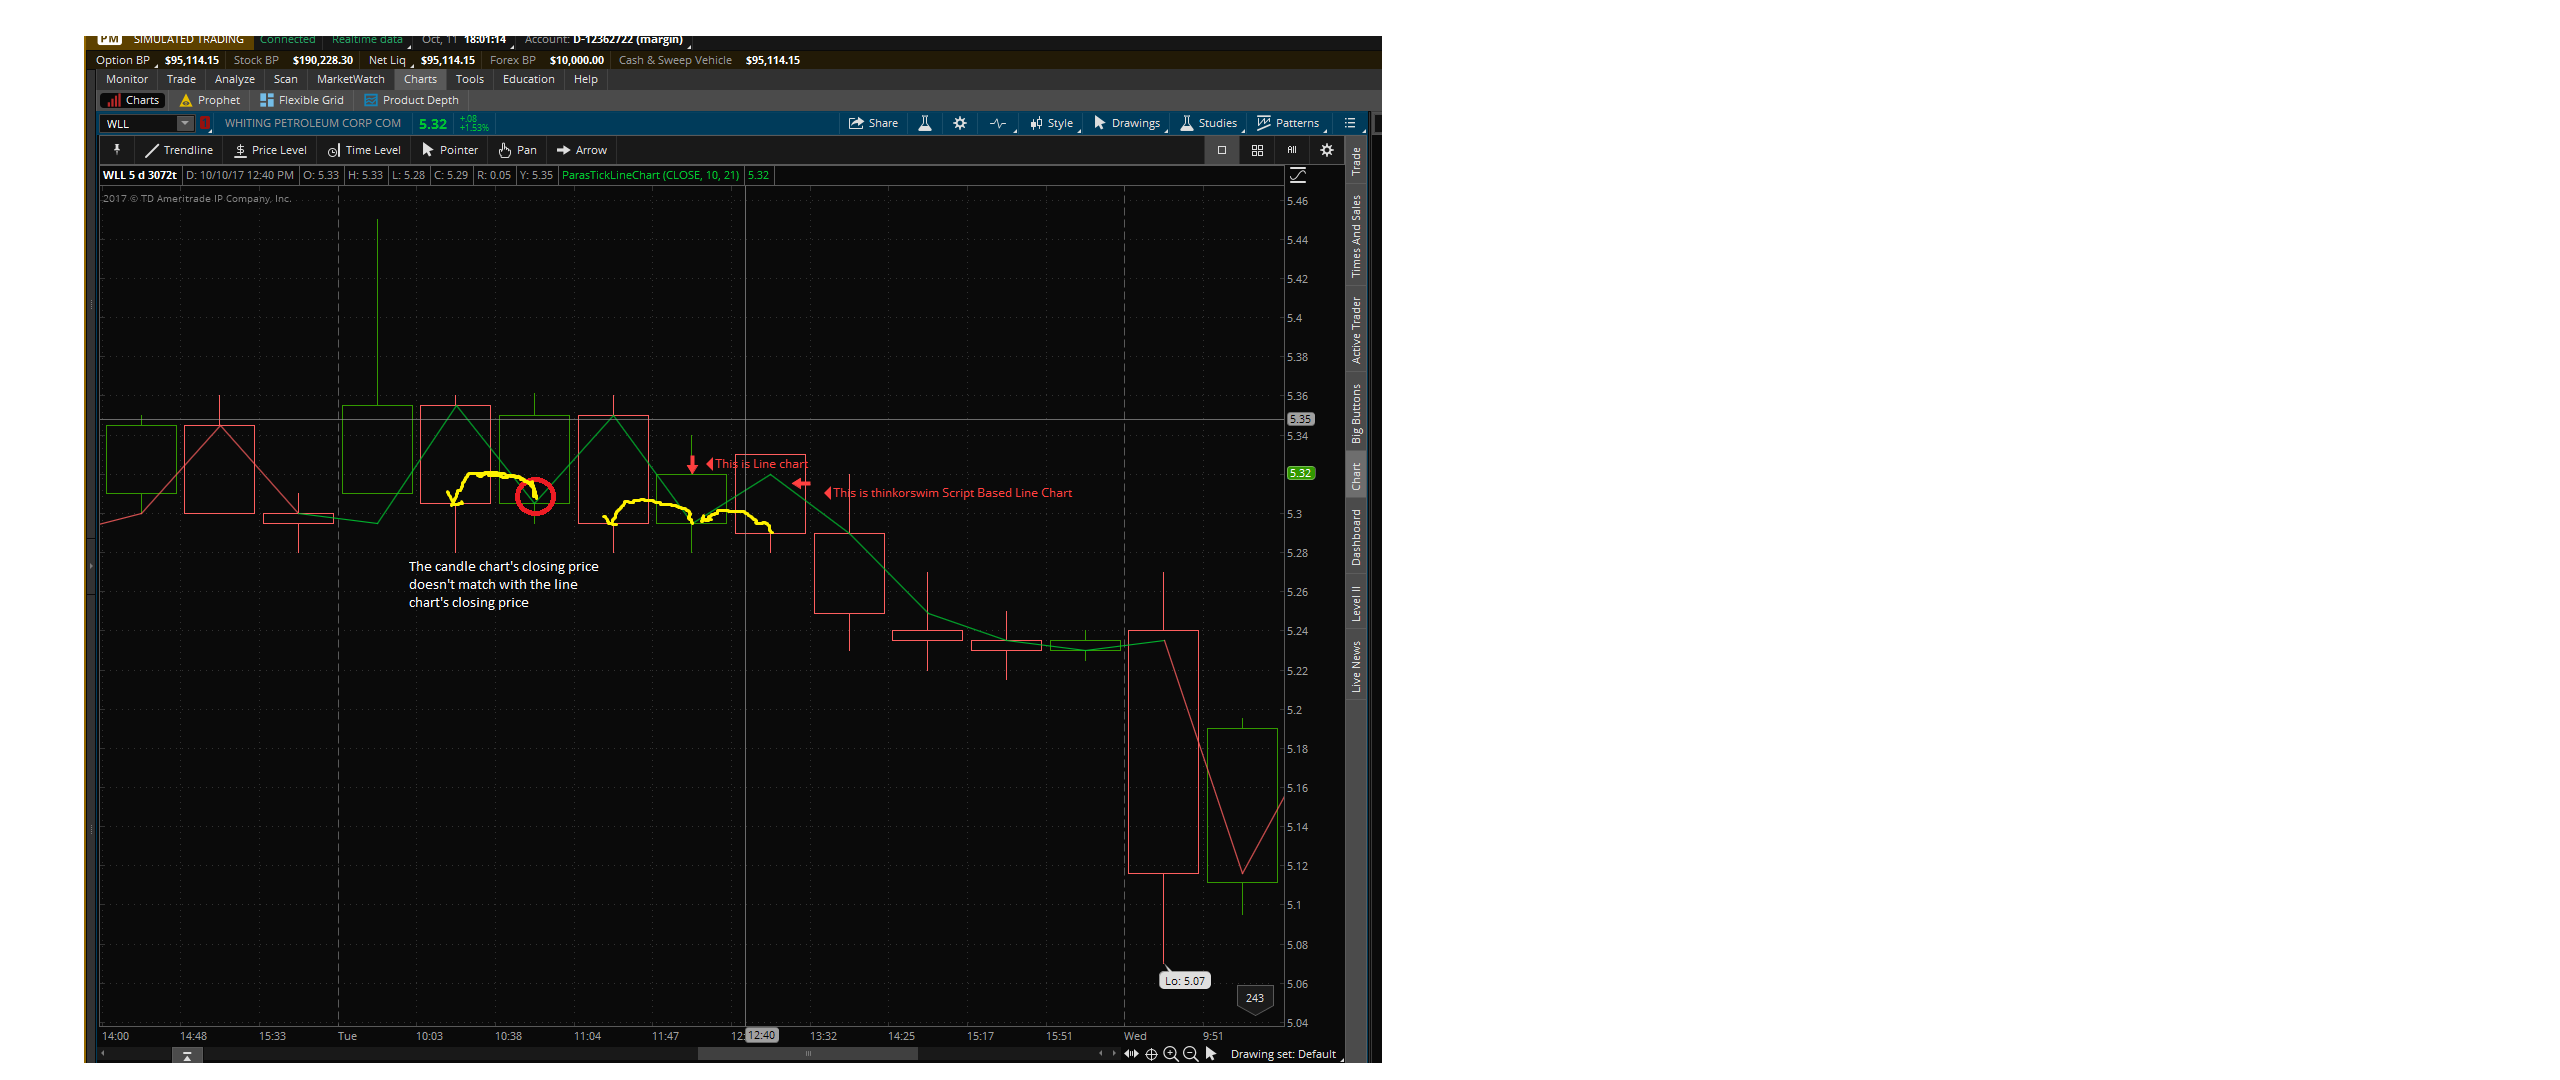
— I am looking for the Line Chart thinkorswim Script so that I could overlap line chart on top of 512 Tick Candle Stock Chart of possible.
Basically line chart and Tick candle chart together on the screen.
I hearty appreciate for your help.
Regards, Paras RESOLVED
Marked as spam
Asked on October 10, 2017 1:17 pm
433 views
|
I am sorry but I do not understand the request. The definition of a line chart, is a single line that plots only the close of each bar. The Open, High, and Low are omitted. I am trying to understand why you are requesting a line chart, but presenting some custom code that has nothing to do with a line chart.
The code you presented plots a single line. But it plots the previous bar’s close. So this is already accomplishing the exact thing you appear to be requesting. I will need more details in order to understand your request. Be sure to include screenshots to explain things more clearly.
Hi Hahn,
Thank you for instant reply. Well, As you know basically Line Chart and RSI form as same way (line and trend point). When I run above script, the script, its shows line chart and trending point one step ahead. Please see attachment.
I am looking the thinkorswim script which will display as line chart (same as above script but display as line chart format and same closing point as line chart display in pattern. Closing price for trend point or trending line.
I hearty appreciate for your advice and help.
Regards,
Paras
My apologies but despite having re-read the question and your reply I still cannot picture how what you are describing is any different than the code you provided. The code you provided draws a single line, at the previous close. What do you want to do different?
You said: “same as above script but display as line chart format and same closing point as line chart display in pattern. Closing price for trend point or trending line.”
But I honestly don’t have a clue what this means. I am going to need to see a screenshot before I can understand what you are asking.