How to plot a line at the end of afterhours instead of close?


Category:
0
0

Pete,
I only post here if I’ve depleted all my options, as I don’t want to waste your time with simple questions. I have a script that plots a line at the close price from the previous day;

  • plot DailyClose = close(period=”DAY”)[1];

I just need a slightly different version of this, to plot the price at 8pm (end of afterhours) instead of the close price. How might I do this? Thanks!

Davide

RESOLVED
Marked as spam
Posted by (Questions: 7, Answers: 12)
Asked on July 14, 2019 1:49 pm
55 views
1
Private answer

The most reliable way to do this is to completely ignore the time component. Because many stocks that have very low volume in extended hours trade and will not have a candle for 8:00 pm. So if we wrote the code to work strictly with the time of 8:00 pm we would find our code failing for the vast majority of stocks.

Fortunately, you are looking for the close of the last bar of the after-hours session. So we only need to check for "newDay". Then grab the close of the previous bar and hold that until the next "newDay".

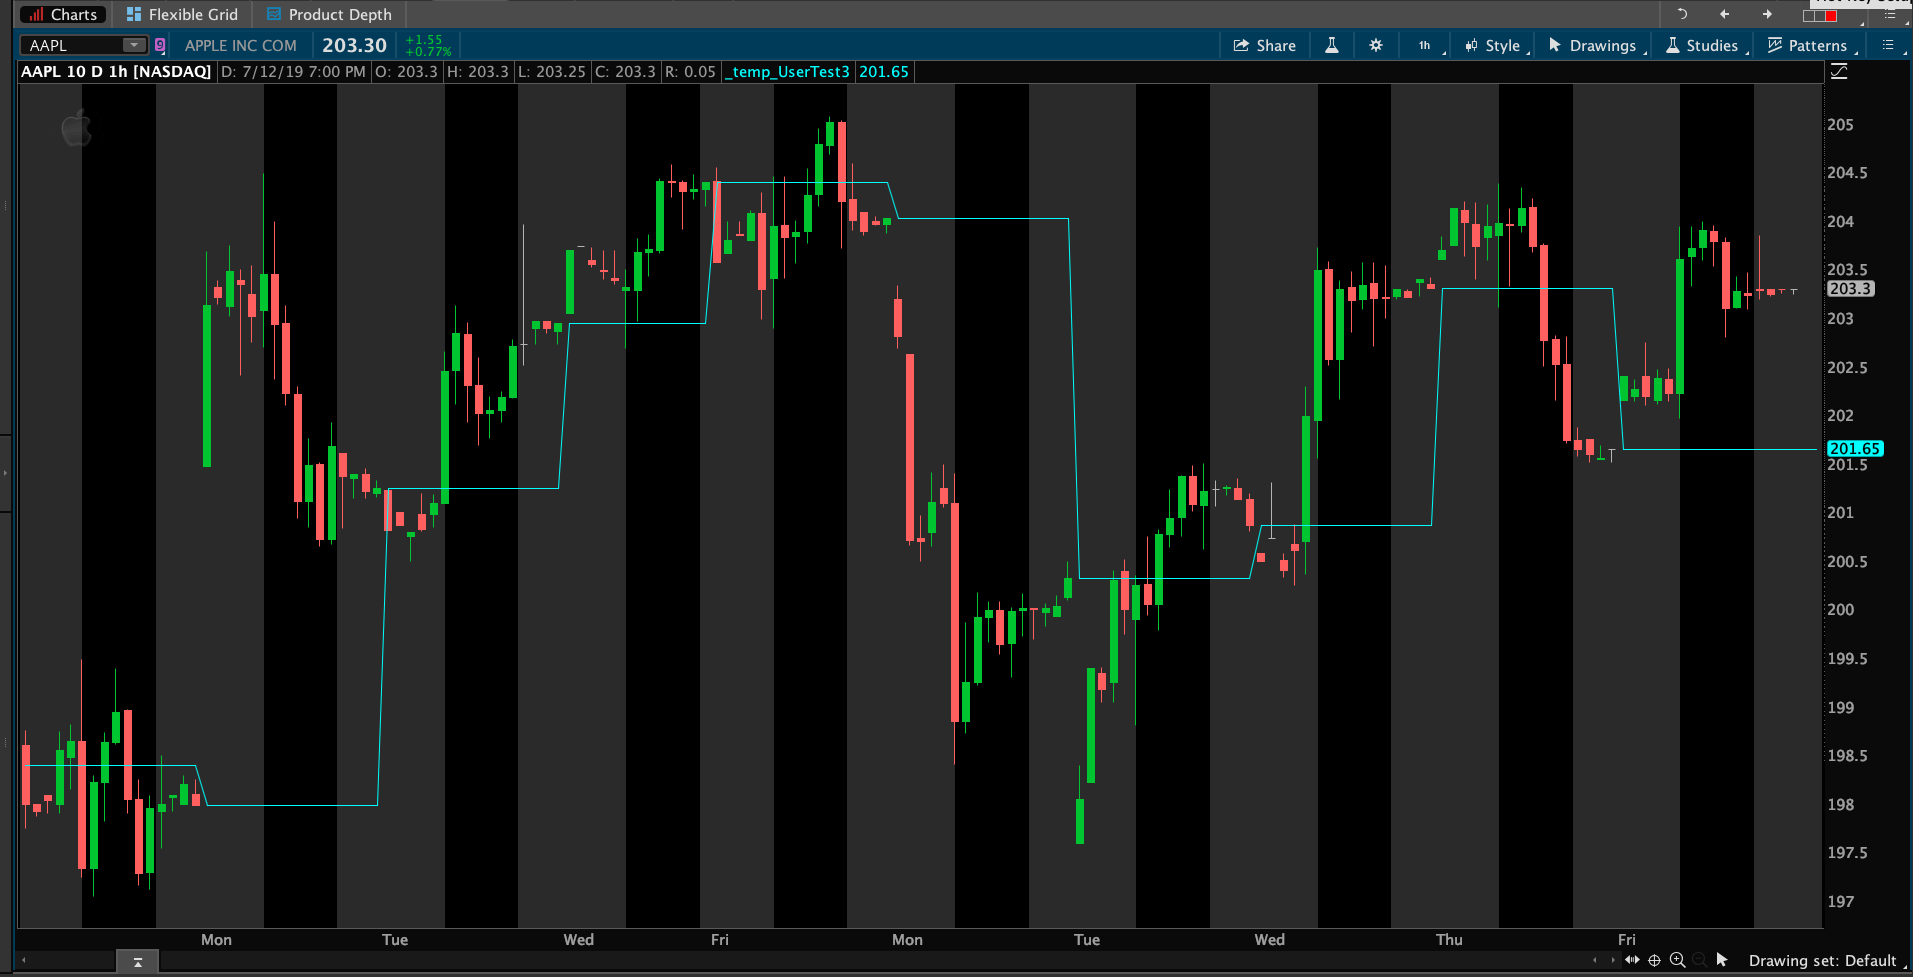
Here is the code. Screenshot below shows the result.

def newDay = GetDay() <> GetDay()[1];
rec afterHoursClose = if newDay then close[1] else afterHoursClose[1];
plot data = afterHoursClose;

Attachments:
Marked as spam
Posted by (Questions: 37, Answers: 4086)
Answered on July 14, 2019 4:11 pm
0
Brilliant as always Pete. I would have never figured that out! lol.
( at July 14, 2019 5:41 pm)