| ♥ 0 |
How to write this as an expression; Current bar is X% greater or lesser than previous bar. With x being an adjustable input.
The motive behind this is to “Plot Scan” and assign price color to the bar if the expression is true. Thanks again Mr Pete.
Marked as spam
Asked on December 5, 2017 2:57 pm
151 views
|
|
Private answer
Ok, so for reference I will point out the original question posted in the Chart Studies topic: https://www.hahn-tech.com/ans/how-to-identify-if-current-bar-is-above-or-below-a-certain-percentage/ We’ll be using the code I provided for that solution as a starting point:
I see from this current request you are asking for two different things. One is a custom scan to find stocks the a percentage change close-over-close greater than x percent. With the x being a user adjustable input. For simplicity, we will call that input “xPercent”. The second item you are requesting is a Chart Study. Probably a detail you meant to include in the original post. You want the chart study to paint the price bars a specified color when the close-over-close percentage change is greater than x percent. The Scan:
The Chart Study:
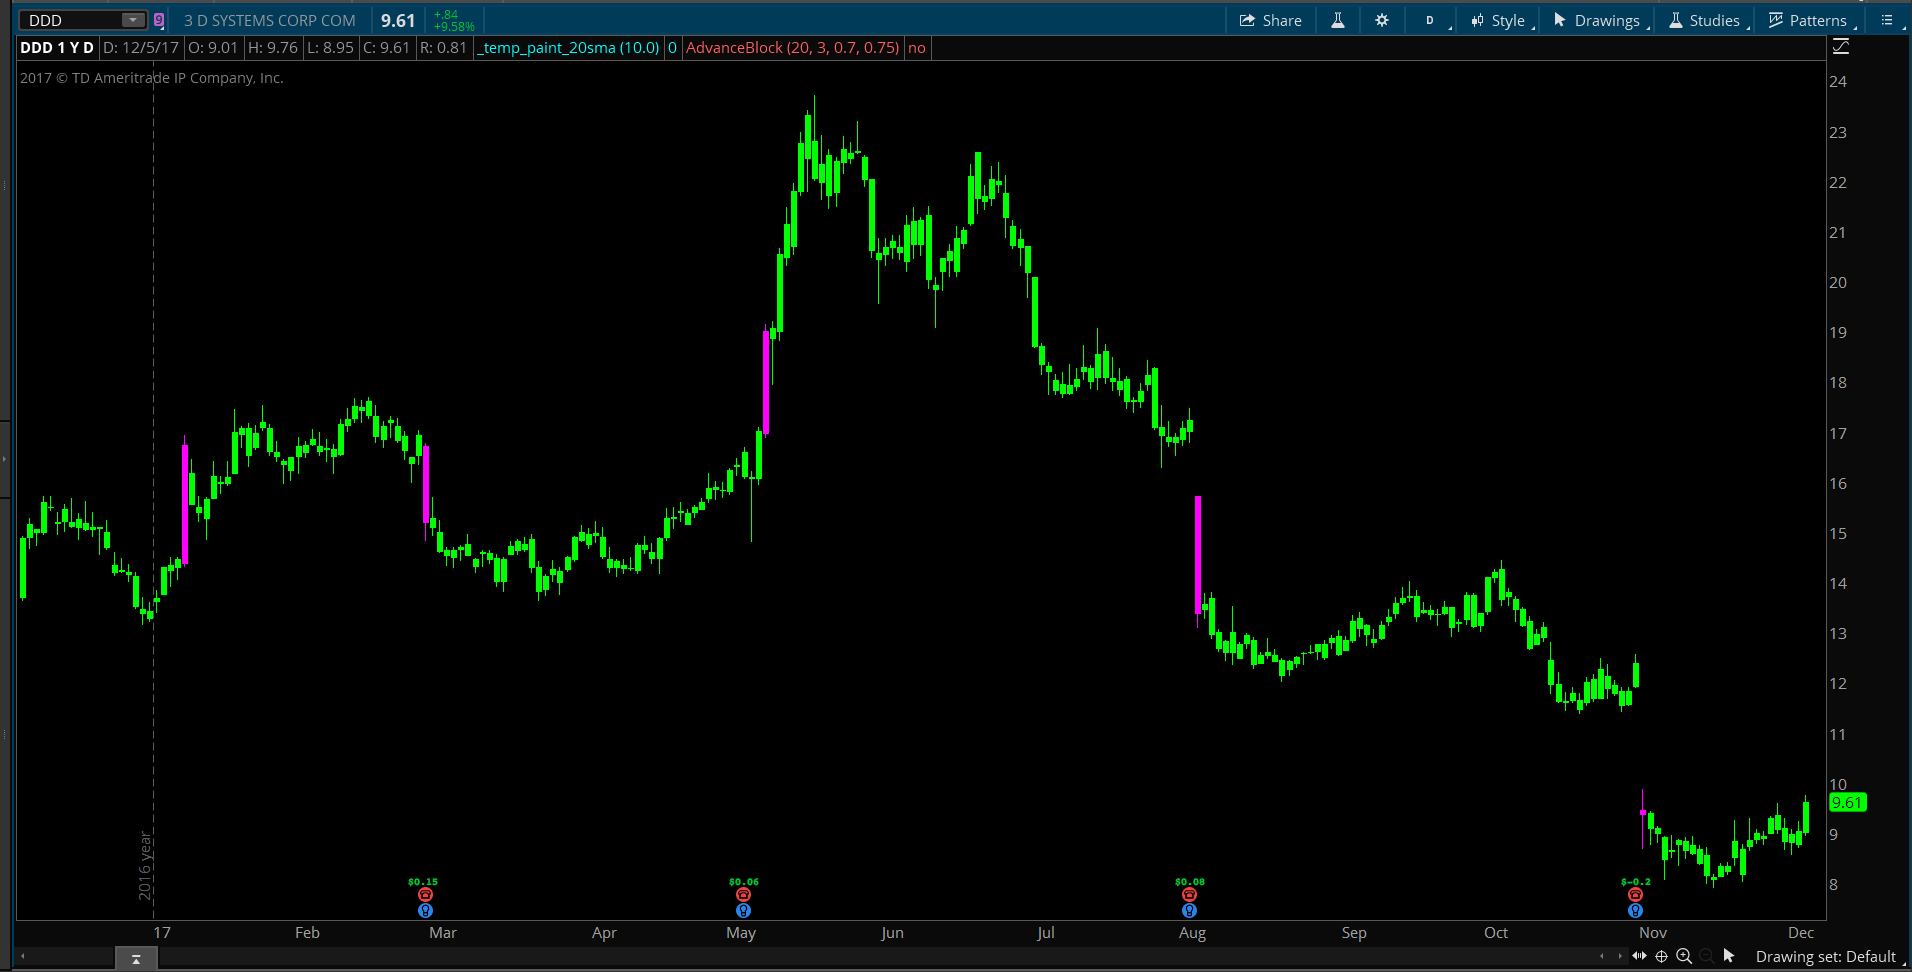
Attached screenshot shows what the paint-bar study looks like. The scan code will pick up any Magenta colored bars occurring on the most recent bar on the chart. Attachments:
Marked as spam
Answered on December 5, 2017 4:18 pm
|