| ♥ 0 |
This is my code. I find a PriceOsc Oscillator Peak Value
####Definition of PrcOscPeak or Valley or High############################ def PO=PriceOsc().PriceOsc;
def OscPeak = if PO >= PO[1] and PO >= PO[2] && PO>= PO[3]&& PO>= PO[4] && PO>= PO[5] and PO>= PO[-1] && PO >= PO[-2] && PO>= PO[-3] && PO> PO[-4] && !OscPeak[3] && !OscPeak[2] && !OscPeak[1] then 1 else 0;
def HChtBarNo = if OscPeak == 1 then BarNumber() else HChtBarNo[1];
def HOBarNoDiff = BarNumber() – HChtBarNo; ########################FirstOsc & Low##########################
def HOBarDiff0 = GetValue(HOBarNoDiff,4)+4; #Add back the Offset def HOTotOffset0=HOBarDiff0;
def FirstOscPeak=GetValue(High,HOTotOffset0);
#works fine I have my first Price Osc Peak value and the corresponding offset, I can do the same thing basically and get my second PriceOsc Peak value , and I can compare them.
#now I wish to take the offset of this Peak at PriceOsc , and , translate the offset up to the price chart, so I can get the local price high at this very same offset or basically the price high within the past 5 bars of this PriceOsc Peak Offset.
so I try the following, but these lines do not work
def FirstLocalSwHigh= GetMaxValueOffset(high[HOTotOffset0],5); # Not Good def FirstLocalSwHigh=Highest(high,HOTotOffset0); while these lines work – CL non-constant area for the parameter) def length=5; #def FirstLocalSwHigh= GetMaxValueOffset(high,length); #Good
How do I take the offset of this Peak at PriceOsc ToS standard function, and , translate the offset up to the price chart, so I can get the local price high at this very same offset or basically the price high with in the past 5 bars of this PriceOsc Peak Offset? or How do I turn HOTotOffset into a constant with another function or GetValue or GetMaxValue or whatever so I can use it to get my local high?
RESOLVED
Marked as spam
Asked on July 8, 2018 2:25 pm
528 views
|
|
Private answer
Because you seemed to have ignored my previous recommendations. Here are my comments on how to write code properly. Taken from this pervious post: https://www.hahn-tech.com/ans/how-do-store-just-swinghighs-or-lows-in-variable-wo-the-0s-or-double-nans/ How to Write Code Properly:
So if you are going to make me read your code, have the kindness to learn and follow the guidelines of real programers. One more note. The other thing that really makes your code difficult to read are the excessive use of abbreviations:
If you are going to use excessive abbreviations than make sure to include copious amounts of comments to explain what each line is supposed to be doing. When you use recursion, it is not required but makes things much more readable when you use rec in place of def. So don’t do this:
Do this instead:
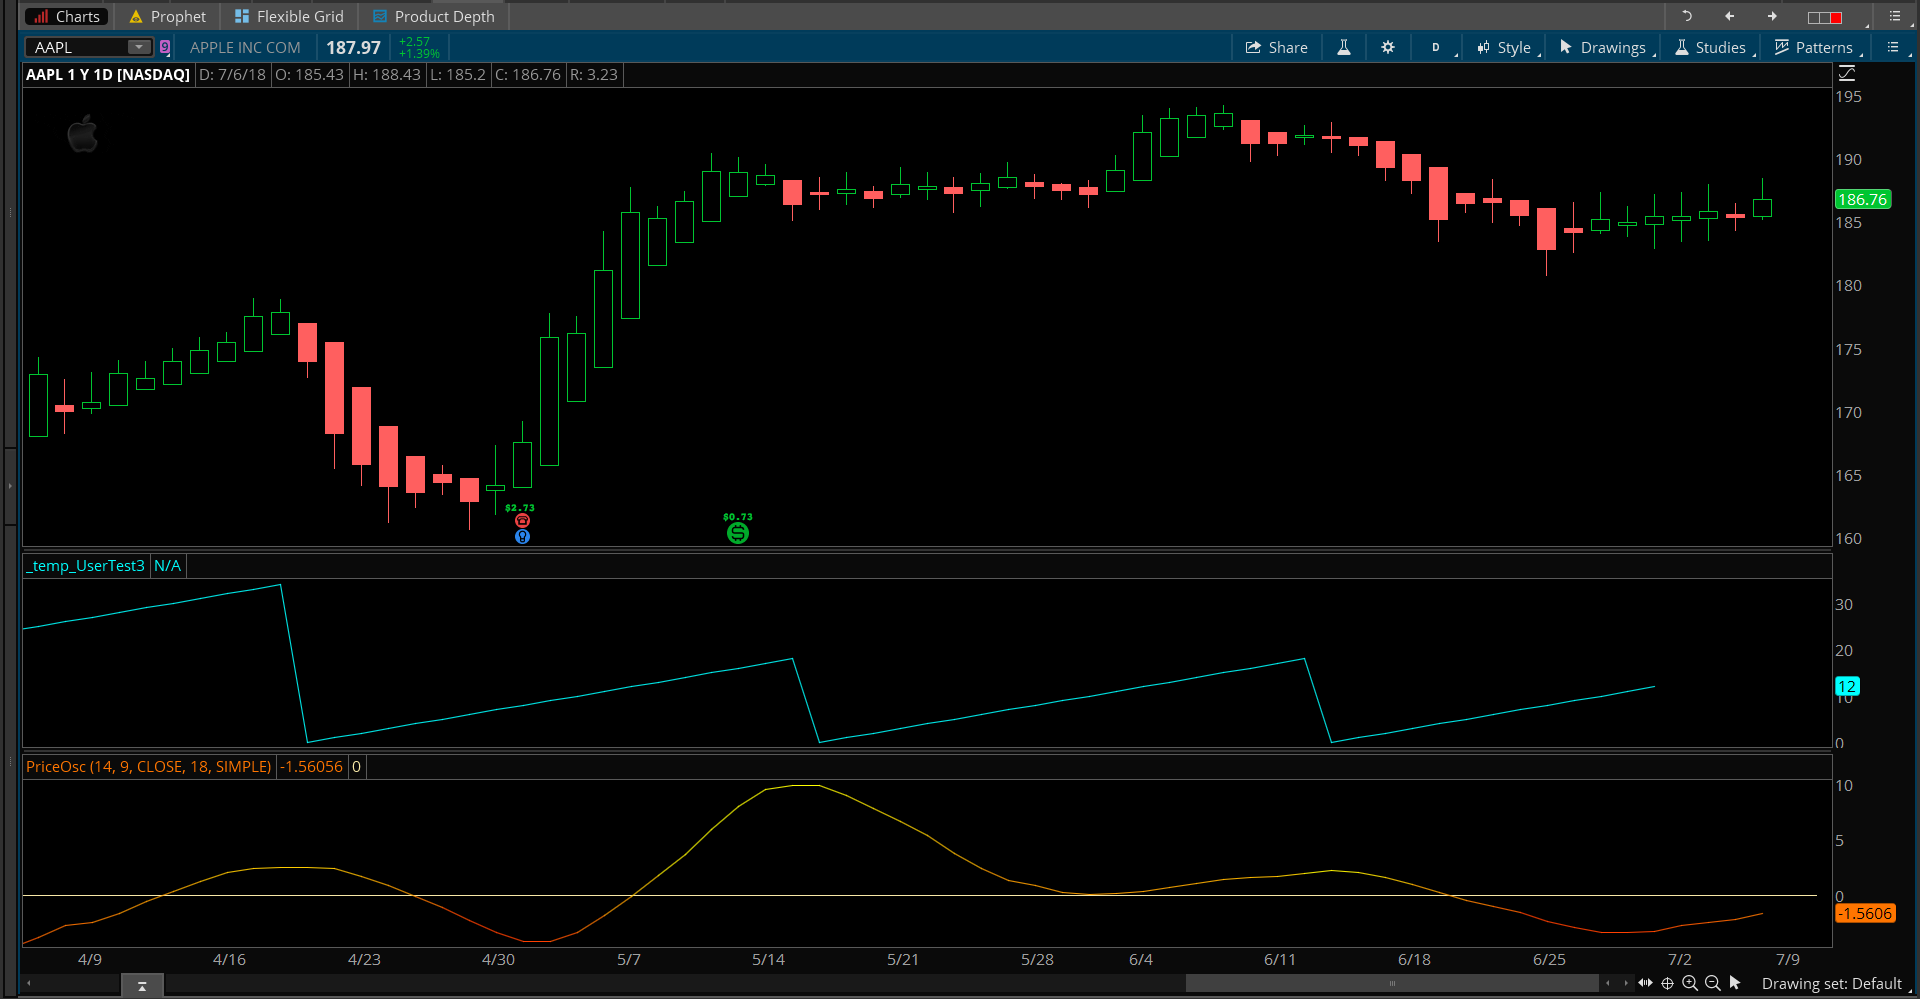
Ok, enough said about proper code styling. Look, when I started out I wrote some really terrible looking code. Really crappy stuff. And some of that crappy stuff is still around. So I understand. But I had others that were providing me bad examples. So for this forum, I want to make sure everyone that sees this stuff realizes what proper code looks like. If we don’t correct the errors, they will simply propagate. On to the SolutionHave you been using plot statements during development to visualize what your code is doing? Here is a section of your code, and this is shown in the first screenshot below (written correctly):
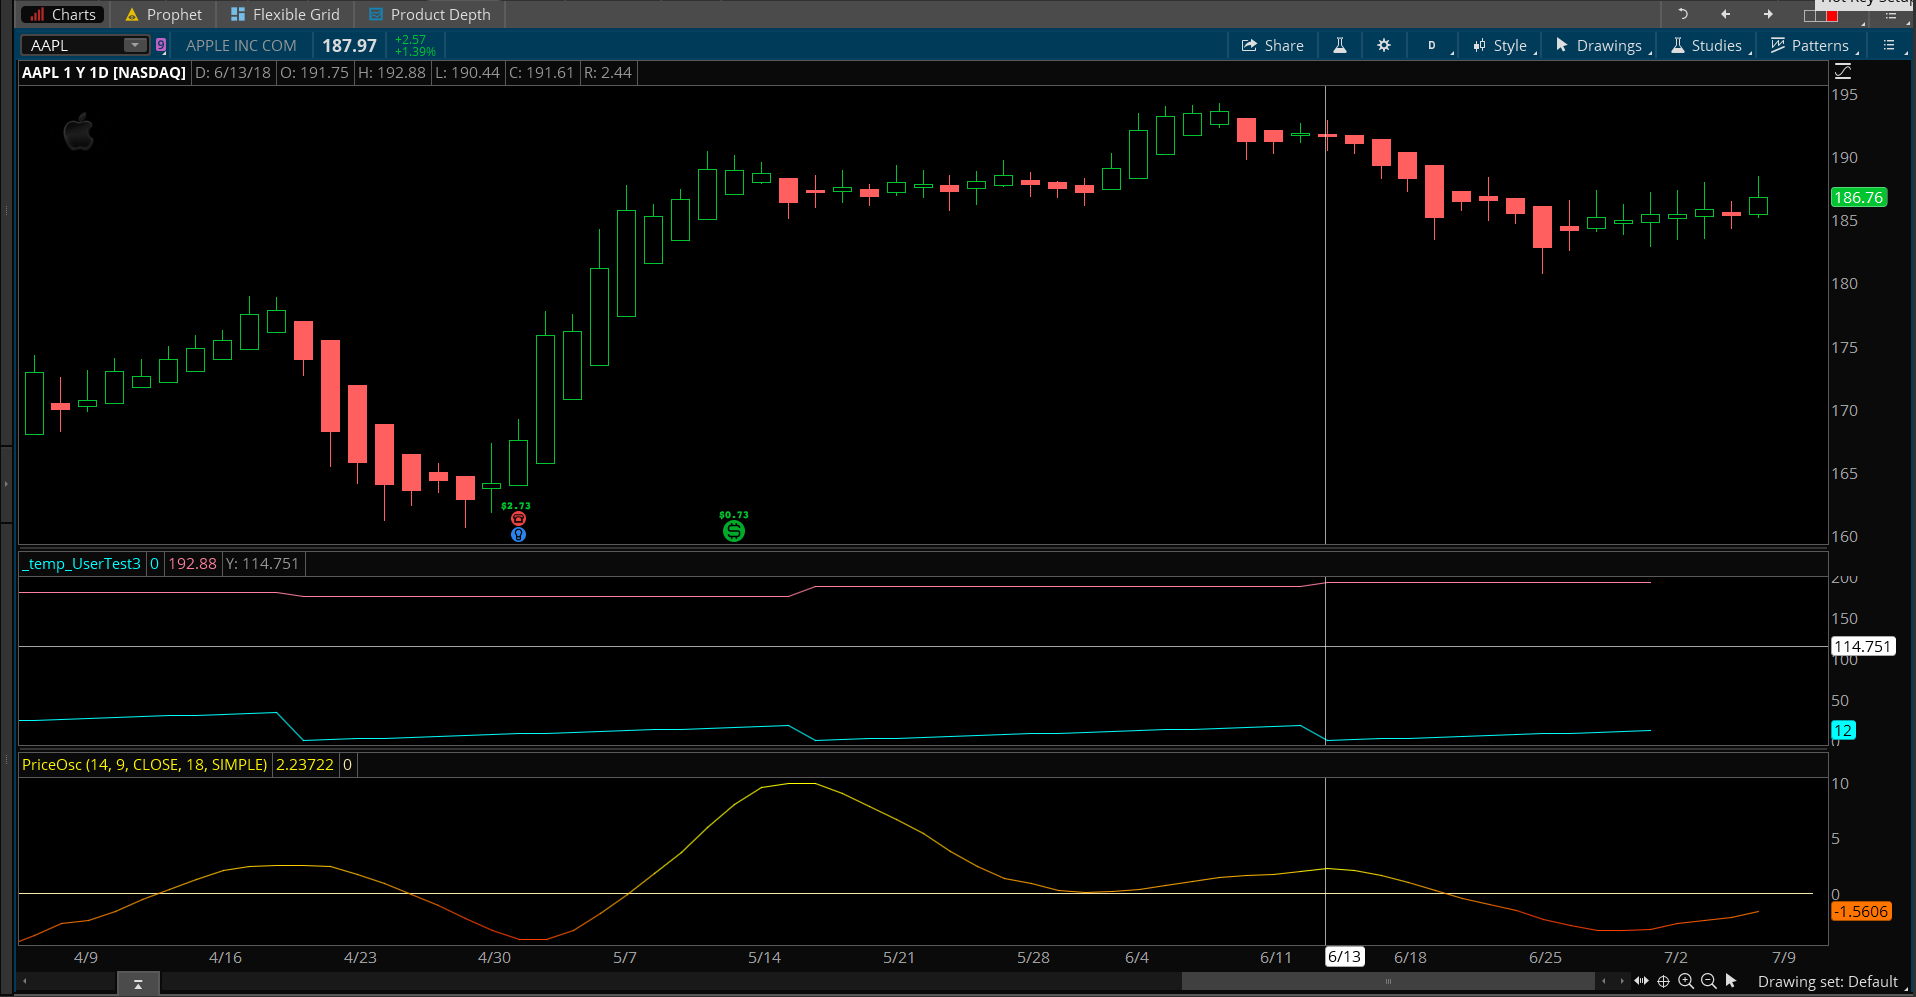
Ok, so the screenshot gives you a visual so you know exactly what your code is doing. Notice for instance, this variable terminates four bars short of the end of the chart. Did you know that? Next stage. We take a bit more of your code, patch it up to look pretty, and plot the next key value on the chart:
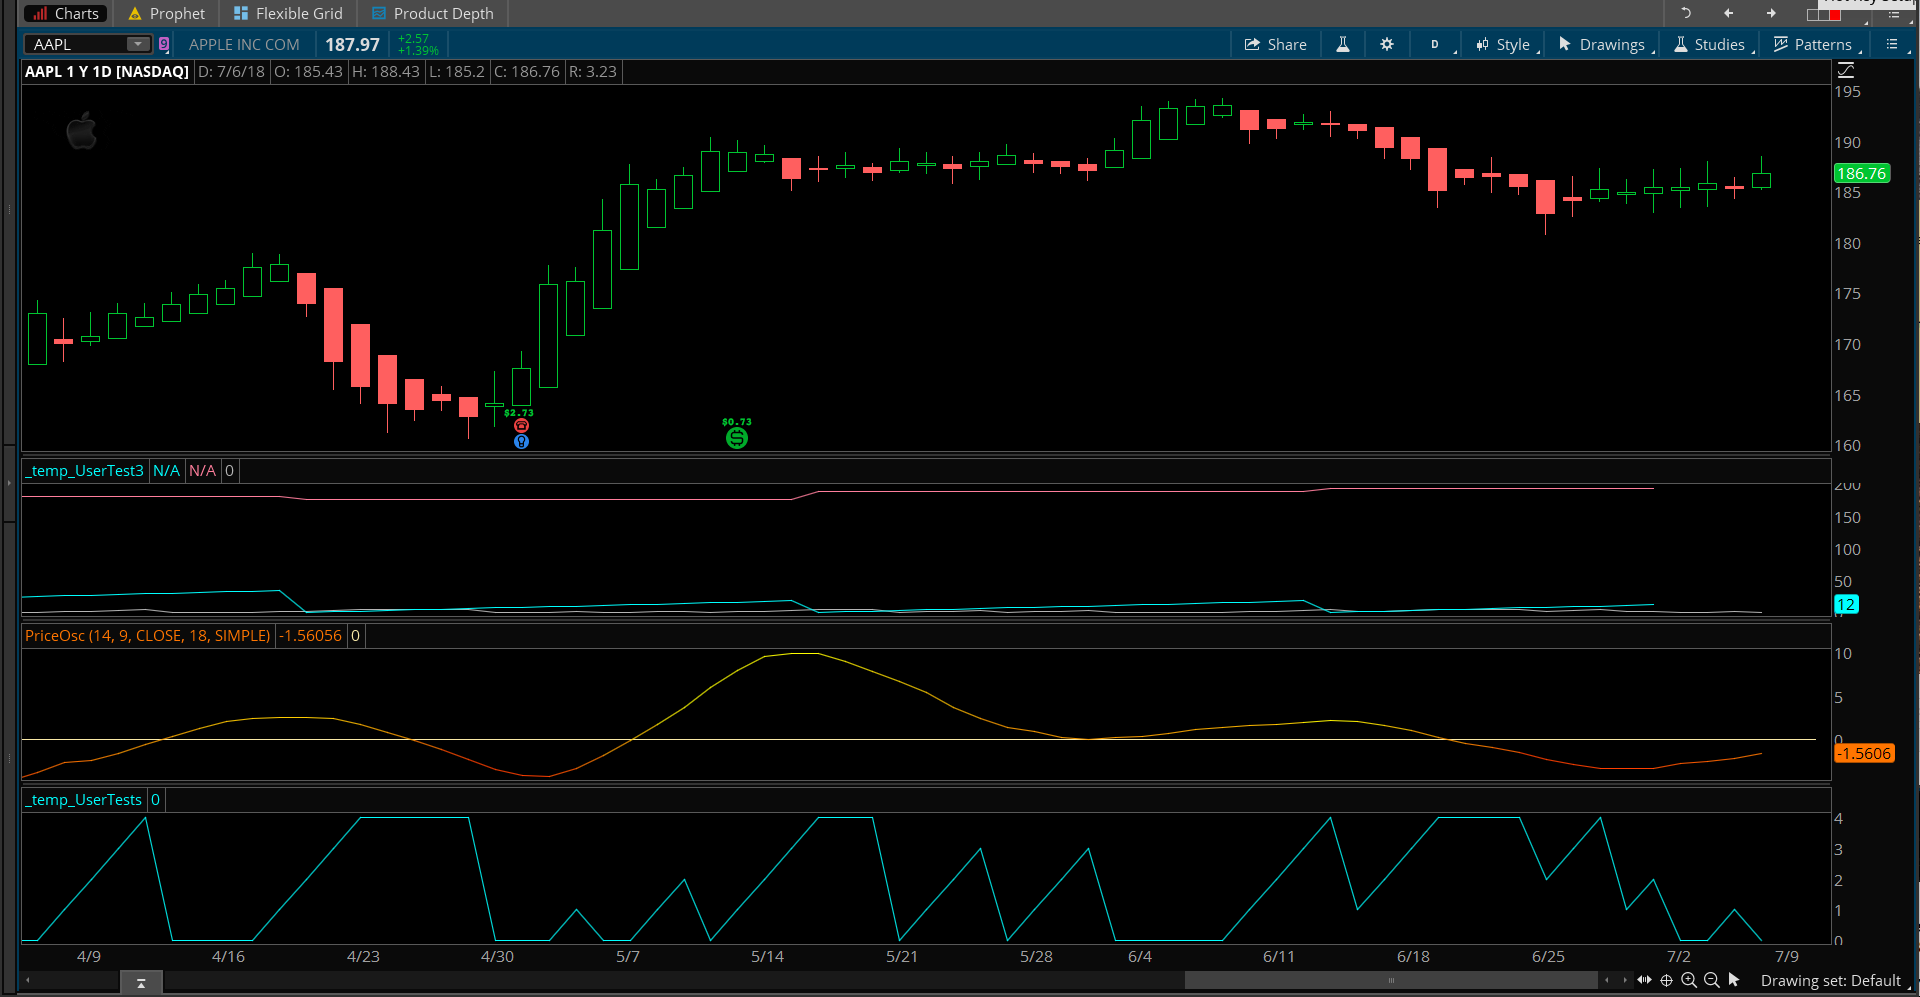
Second screenshot shows the result. Crosshairs are aligned with a previous oscillator peak and red line shows the high when that peak occurs. Everything is good up to this point. But it all falls to pieces after this. Mainly because you are using the GetMaxValueOffset() method and expecting to retrieve the highest high in the previous 5 bars (accounting for the oscillator peak offset). But if you read up on that method: http://toslc.thinkorswim.com/center/reference/thinkScript/Functions/Tech-Analysis/GetMaxValueOffset.html we find that it returns the number of bars since the highest value and NOT the highest value itself. Go ahead, whip together a couple lines of code to plot that on a chart and see for yourself. You need to learn to use the plots on the charts as your troubleshooting method. Because in Thinkorswim we do not have any other way to troubleshoot our code. So learn by practice. Like this:
Third screenshot shows this plotted on the lowest subgraph. Rather than provide a solution for you I will expect that you can take these trouble shooting techniques and finish the job. I would suggest you use a recursive variable to grab and hold onto the “highest high in 5 bars before oscillator peak”. Rather than trying to use these dynamic index values that gum up the works in Thinkscript language. In closing, why on earth are you spending so much effort trying to build a divergence study from scratch, when you can easily buy mine and learn how it’s all done?
Attachments:
Marked as spam
Answered on July 8, 2018 3:59 pm
|
I went ahead and re-wrote the whole Divergence program according to proper code style, not just the First Price Osc’s local high, I am sure you will be glad to learn.
Yes, I knew about compensating for the 4 bars to get the exact oscillator peak, that is how I got my previous script you helped me with going, which involved comparing 3 pairs of past swingHighs and lows.
I apologize, I really should have spent more time on the script before submitting the question. I just was running into the GetValue() & related functions problem again, and I wanted know those functions limitations.
I did achieve what I wanted with the script the next day, but I never was able to do it with nested GetValue() as I think you were suggesting. I wish I could have but rather translated 8 pts in front of the peak of the lagging oscillator called the PriceOsc. Then I compared them using the functions Max() and Min() to get the highest or the lowest, correspondingly. It is pretty primitive, but it got the job done.
def oscillatorPeakOffSetZero = GetValue(oscillatorPeakOffSet,4)+4; #Add back the Offset
#AddLabel(yes,”oscillatorPeakOffsetZero= “+oscillatorPeakOffsetZero,Color.Dark_Green);
def firstOscPeak=GetValue(PriceOsc().PriceOsc,oscillatorPeakOffsetZero);
def potFSH1 = GetValue(high, oscillatorPeakOffSetZero +1);
def potFSH2 = GetValue(high,oscillatorPeakOffSetZero+2);
def fMax01=Max(potFSH1,potFSH2);
def potFSH3 = GetValue(high, oscillatorPeakOffSetZero+3);
def potFSH4 = GetValue(high, oscillatorPeakOffSetZero+4);
def fMax02=Max(potFSH3,potFSH4);
def potFSH5 = GetValue(high, oscillatorPeakOffSetZero+5);
def potFSH6 = GetValue(high, oscillatorPeakOffSetZero+6);
def fMax03=Max(PotFSH5,PotFSH6);
def potFSH7 = GetValue(high, oscillatorPeakOffSetZero+7);
def potFSH8 = GetValue(high, oscillatorPeakOffSetZero+8);
def fMax04=Max(potFSH7,PotFSH8);
def fMaxI=Max(fMax01,fMax02);
def fMaxII=Max(fMax03,fMax04);
def oFirstSwingHigh=Max(fMaxI,fMaxII);
This was the closest, I got I think, to doing it in a much briefer and cleaner way( I tried several combinations other than this):
def firstOscPeak=GetValue(PriceOsc().PriceOsc,oscillatorPeakOffSetZero);
def oneSwingHigh= GetValue(High,oscillatorPeakOffSetZero,0);
def oFirstSwingHigh=Highest(oneSwingHigh,8); # unfortunately, it is not the highest od a range of 8 values, just highest of one value.
If you have a slicker way, please tell me. Otherwise, in 2 days, I will mark it as resolved.
Well I’m glad you managed to work out a solution. You know that phrase: “Work smart, not hard”? Well that is some really hard work there. (NOT saying it’s stupid. Just saying it’s not the EASY way). This is brute force coding. Seen tons of this stuff. Usually from those in the engineering fields.
In our family we have a saying. “If you want to know the easiest way to do something, ask the laziest person you know”. I, am extremely lazy.
In my premium divergence studies I measure divergence based on two separate lower studies and do it within 16 lines of code. Both positive and negative divergence, for two lower plots. (not counting the code to compute the lower studies or get user inputs). And that covers an entire chart with unlimited number of divergence plots.
Oh, and within those 16 lines of code there is not one use of the GetValue() statement. That should give you some meat to chew on for quite a while.