Invert shading on Moving Average Columns


Category:
0
0

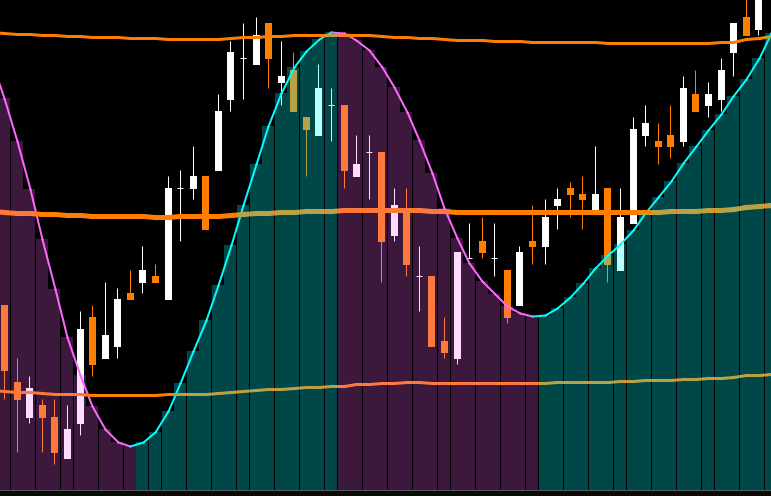
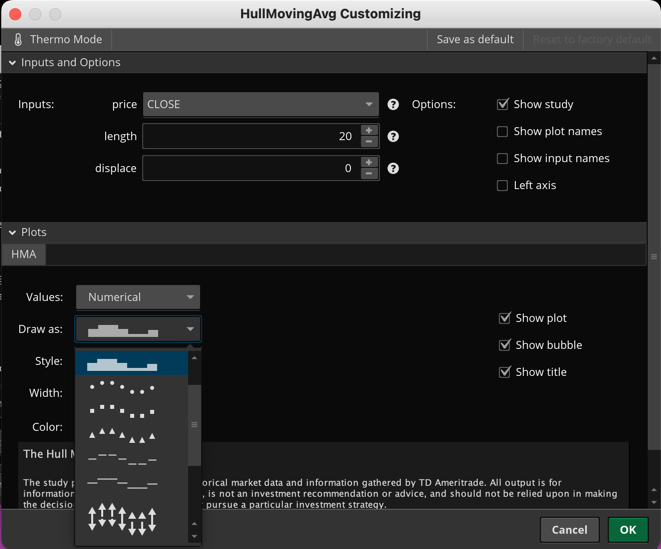
In TOS I am able to change the Hull Moving Average to be displayed as a columns. Then I adjust the transparency so that they are only slightly visible. This makes it easy to see when the price candles are poking above the HMA.  The columns shade in from the bottom of the chart, up towards the moving average line (regardless of uptrend/downtrend).

I was wondering if it is possible to invert this so that when the HMA is descending, the columns shade in from the top of the chart down towards the HMA line.  That way when price is descending steeply and beyond the HMA the candles will stand out (as they do when price is ascending).

Ideally the columns would shade in from the top of the chart to the HMA line when downtrend, but then, when uptrending, it would stay the way that it is (columns shading up to the HMA line from the bottom of the chart)

I hope I did a decent job of explaining that~ Thanks for any help.


Attachments:
RESOLVED
Marked as spam
Posted by (Questions: 7, Answers: 1)
Asked on June 9, 2022 8:40 pm
79 views
0
Private answer

Posting a screenshot like that without explaining how you manage to make that work. You realize almost everyone who comes across this post is going to be asking how you did that? Not to worry. I am providing my own screenshot showing how top adjust the plot settings to match your screenshot.

Ok, now let's talk about how to solve your question. What yo have there is a histogram plot. Depending on chart settings, this type of setting may force the price range to automatically adjust to include the value of zero at the bottom of the chart. When that happens, the candles of the chart are restricted to a thin line at the very top of the chart. Viewers who are not aware of this setting would be pulling their hair out trying to figure that one out. Huh? Oh Yeah... That setting is named "Fit Studies" and you will find it on the Price axis tab of the Chart Settings window.

In order to accomplish what you have described would require the plots be changed back the original setting. Then the code would need to be updated to include an at least one AddCloud() statement. The AddCloud() statement would need to have an if/then/else condition which sets the top and bottom values based on the same rules that change the color of the Hull moving average.

The following solution includes user inputs which allow you to change all aspects of the moving average:

input maLengthOne = 21;
input maTypeOne = AverageType.HULL;
input maPriceOne = close;
plot maOne = MovingAverage(maTypeOne, maPriceOne, maLengthOne);
maOne.DefineColor("Up", GetColor(1));
maOne.DefineColor("Down", GetColor(0));
maOne.AssignValueColor(if maOne > maOne[1] then maOne.color("Up") else maOne.color("Down"));
AddCloud(if maOne > maOne[1] then maOne else Double.POSITIVE_INFINITY,
if Double.NEGATIVE_INFINITY then maOne else maOne < maOne[1], Color.MAGENTA, Color.CYAN); AddCloud(if Double.POSITIVE_INFINITY then maOne else maOne > maOne[1],
if maOne < maOne[1] then maOne else Double.NEGATIVE_INFINITY, Color.CYAN, Color.MAGENTA);

Attachments:
Marked as spam
Posted by (Questions: 37, Answers: 4089)
Answered on June 9, 2022 9:04 pm