| ♥ 0 |
Currently when I am in a trade looking on my charts tab, the only way I know to check the current P&L is to click over to the monitor tab. Is there a way to view the P&L on the charts tab or some alternative that would allow me to see both at the same time? Thanks in advance.
Marked as spam
Asked on May 4, 2017 1:00 pm
15474 views
|
|
Private answer
It is possible to add a chart label to an individual chart. The chart label function is very basic. You can read more here: http://toslc.thinkorswim.com/center/reference/thinkScript/Functions/Look---Feel/AddLabel.html This single line of code will display a chart label in the upper left corner of the chart showing the current P/L for the symbol being charted:
The key to this line of code is a function called GetOpenPL(). There are restrictions to what time frames are supported for this function. This function does not work in a custom watchlist column. You can read more details here: http://toslc.thinkorswim.com/center/reference/thinkScript/Functions/Portfolio.html If you wanted the chart label to display the P/L of a symbol other than what is being plotted you can do this:
You just change the ticker symbol in quotes to something that is in your current account portfolio. In this way you could add multiple chart labels, one for each symbol. And you can update the text of the label to display the ticker symbol assigned to each:
If you wanted the total combined P/L for all open positions you would need to add lines of code to get the P/L for each symbol, add those values together and display them in a chart label:
As a homework assignment, I would like to see someone post the code required to show the P/L of an option position. Hint: you would use the OPRA code as the symbol. Let’s see if you can work out how to show the P/L for a complex spread like a calendar or butterfly. Be sure to up-vote any answers that best solve your question! Marked as spam
Answered on May 4, 2017 3:28 pm
|
|||||
|
Private answer
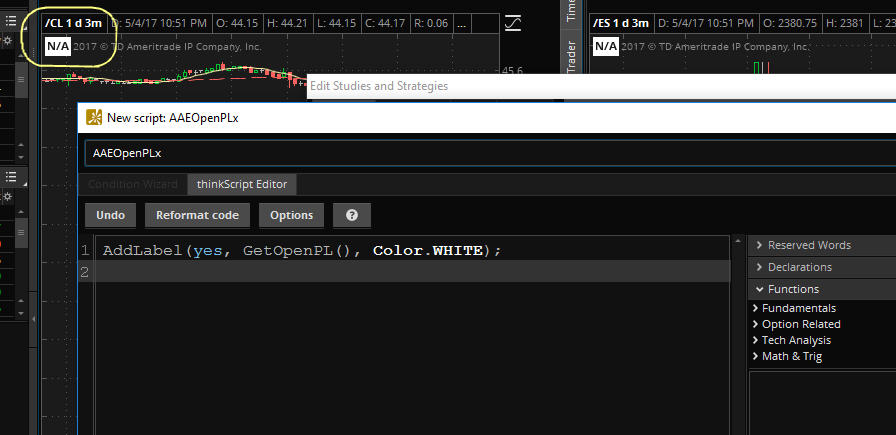
Pete, awesome response! Thank you so much. I added that code to a new study and add it to a chart. The label appears in the upper left with a “N/A” but I am assuming that is because the market is closed? I’ll test it when the market is open. Thank you. Marked as spam
Answered on May 4, 2017 4:30 pm
|
|||||
|
Private answer
Pete, thank you for your help. The attached screen shot shows the time frame I am using (which seems to be in the list from the link you provided) and also the exact code I am using.
Attachments:
Marked as spam
Answered on May 4, 2017 8:56 pm
|
|||||
|
Private answer
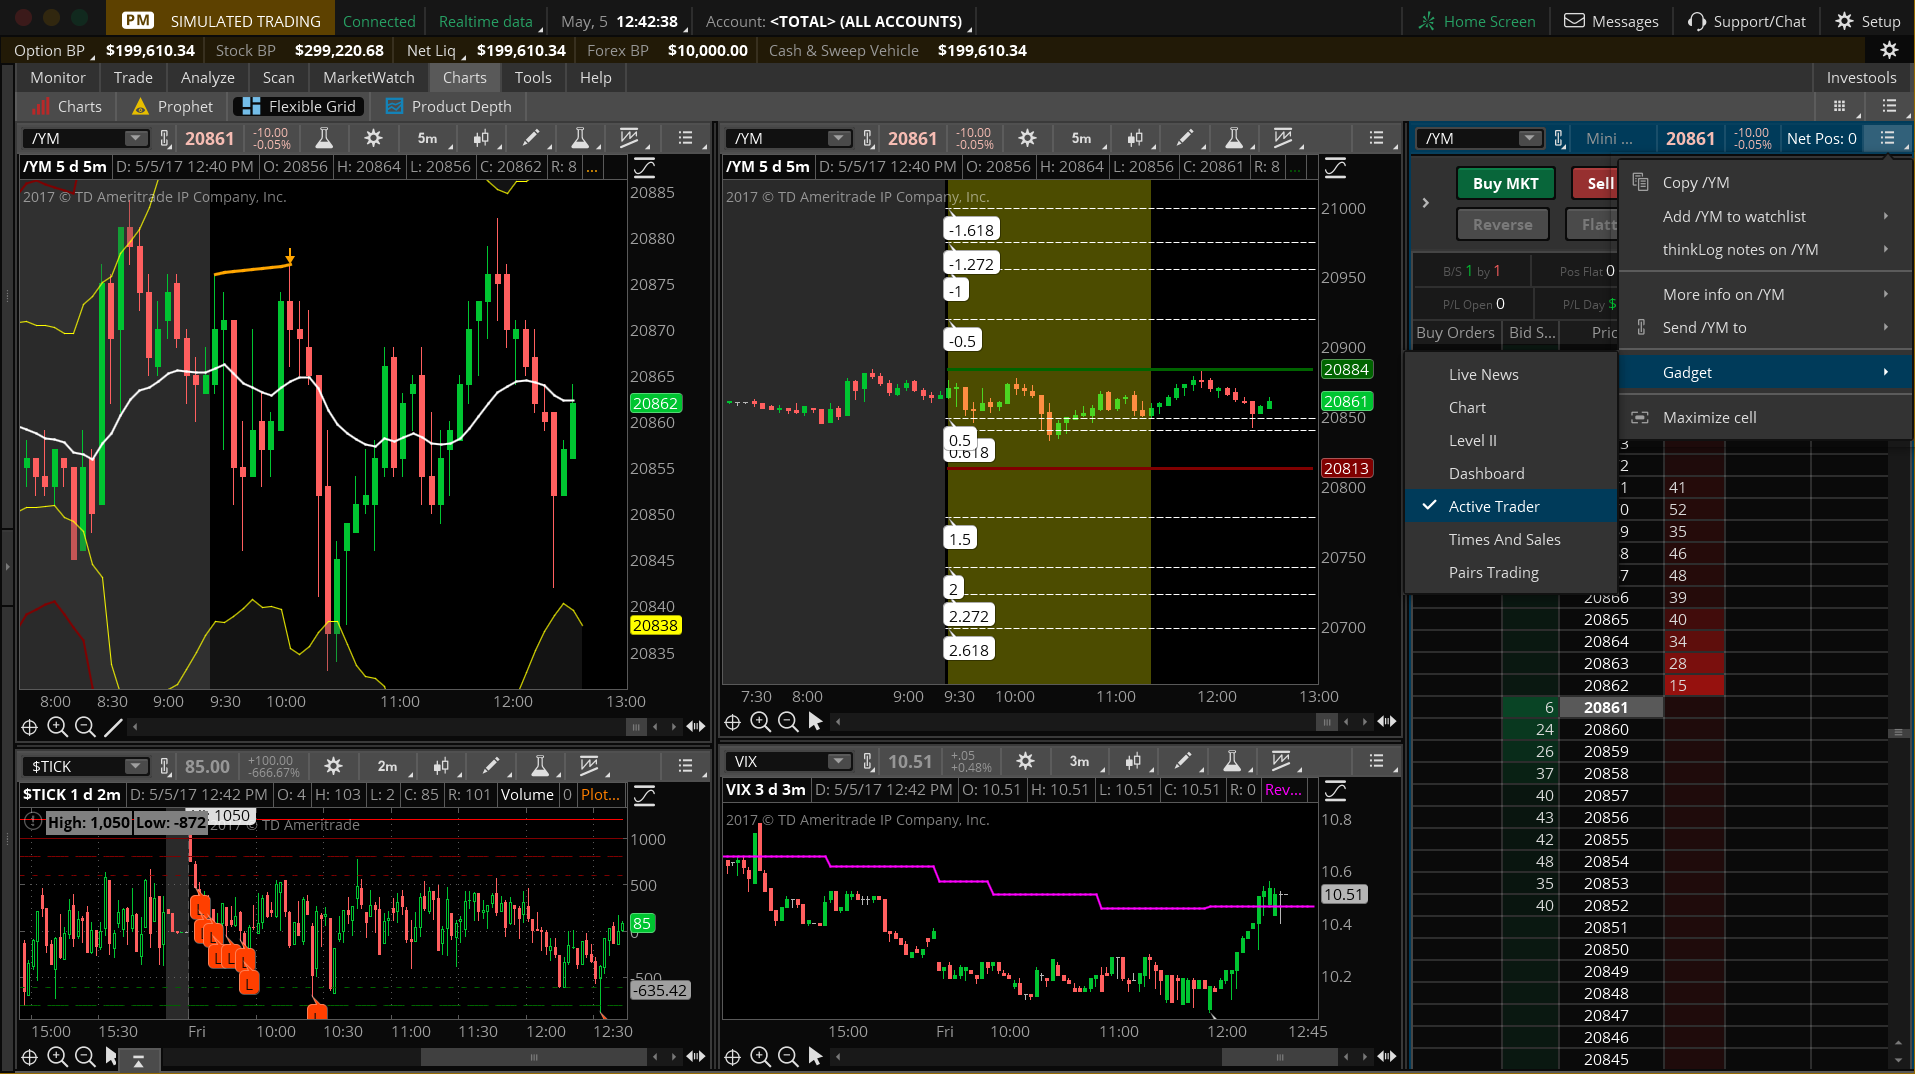
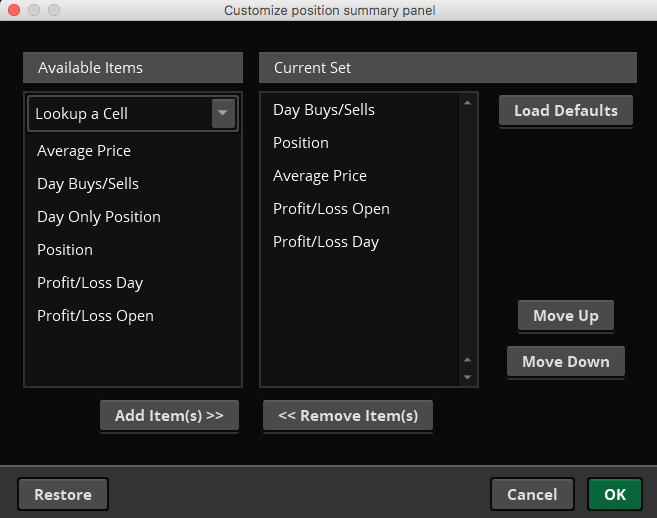
Since this technique does not work on PaperMoney, we have another way you can view current P/L data without leaving your charts. This method can only display current P/L data for a single ticker symbol at a time. The tool is called Active Trader and can be added to any of the cells within a Flexible Grid layout. See screenshot below for details on how to set one of the cells to active trader. Also attached is the settings view for the active trader showing available P/L elements to display. Attachments:
Marked as spam
Answered on May 5, 2017 9:50 am
|
Is your homework assignment possible? I would be very interested in something like this. What code would allow me to pull all of my open option positions linked to an individual underlying?
The homework assignment is possible. I created one for calendars and another for butterflies. They require the manual input of OPRA codes and entry price. As to the second part of your question. There is a built in watchlist for account positions. That is the closest you can get. You can add columns to the watchlist showing current P/L and other metrics related to account positions.
Thanks. That is about where I was at. Manual input but no way to pull a position on a derivative. I have contemplated trying GetNextITMOption / GetNextOTMOption to look at all strikes and check for a position. It would not be an ideal solution.
ProfitLossMode.COST_BASIStoProfitLossMode.EXECUTION_PRICE, but it still does not match. It changes obviously, but does not match.