This is a great question. Very well explained and you provided your own code. Love this.
Convert to Exponential Average
Let’s begin with your very last request. The middle band should be a 20 period Exponential Moving Average. As your code exists, that middle band is a Simple Moving Average:
def average = Average(price, length);
So we first need to change that to get you the Exponential Moving Average you require:
def average = ExpAverage(price, length);
There, that was simple wasn’t it?
Does it work?
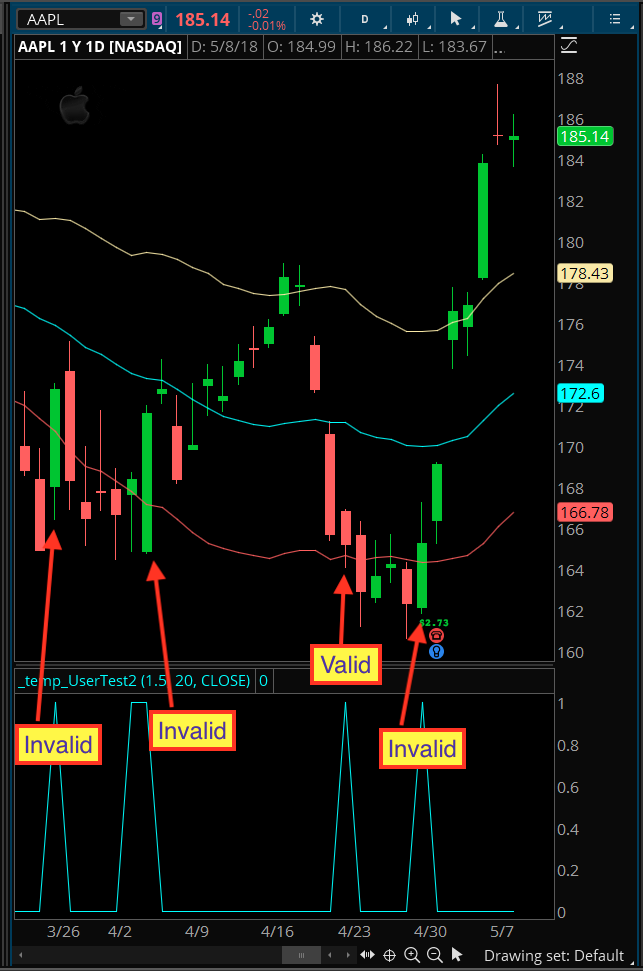
The bad news is that your code is missing an important piece. See attached screenshot. I have added your code as a lower study on the chart. I have marked the various signals on the chart generated by your code. I see only one valid signal.
At this point I can either wait for you to provide more details or I can make some assumptions and proceed with the solution. I choose the later. I will assume that when you say:
“stocks that have pierced through the lower keltner channel”
What you mean is that prices should be above the lower band leading up to the pierce. While at the same time the bar that pierces should have opened above the lower band.
The Fix
So we will revise your code to fit that:
input factor = 1.5;

input length = 20;

input price = close;

def shift = factor * Average(TrueRange(high, close, low), length);

def average = ExpAverage(price, length);

def Avg = average;

def Upper_Band = average + shift;

def Lower_Band = average – shift;

def previousBarAbove = low[1] > Lower_Band;

def piercingBar = open > Lower_Band and low < Lower_Band and close > Lower_Band;

plot scan = previousBarAbove and piercingBar;
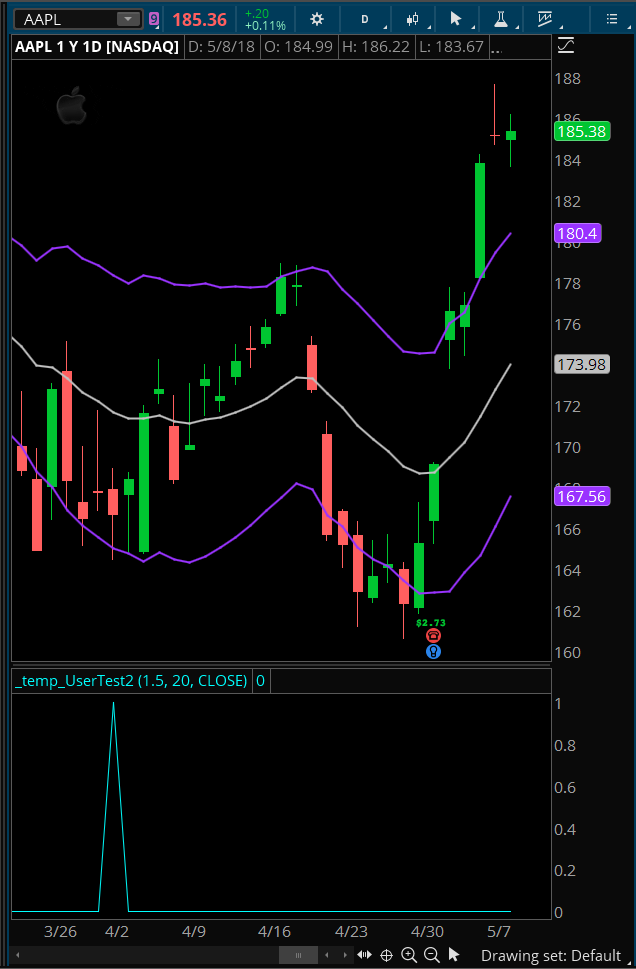
Second screenshot shows the improved version. Also note in this second screenshot I am using a modified version of the Keltner Channel that comes with Thinkorswim. The standard version uses a simple moving average so I modified one to use the exponential moving average. This ensures we can see on the chart exactly what is taking place in the scan.
Code Review
Notice the modifications I made to your code. I break out the price pattern into the smallest individual pieces. We have previousBarAbove as the first piece and piercingBar as the second. This makes the code much easier to read and debug. You can plot those pieces individually to see what each one is doing. Just change the def to plot to display them on the chart.
This also makes it much easier to modify the specifications. Let’s say you need to have two bars above the lower band before the pierce, instead of just one:
plot scan = previousBarAbove and previousBarAbove[1] and piercingBar;
The Hourly Scan
Now, how about that hourly scan?
“at least 1 hourly bar’s range was outside of the lower channel within the last 2 days (or 14 bars)”
Once again I have to make an assumption here. You used the term “outside the lower channel”, while the only options are to be above or below. We cannot be outside a single line. So I will interpret this to mean you want the range of one hourly bar in the past 14 to be “outside” the Keltner channel. More specifically, below the lower band (because outside the channel could also mean above the upper band).
Ok, so we do the same as we have for the daily, with the added condition that the high of any of the previous 14 bars (excluding the previous) should be below the lower band. Why do we exclude the previous? Because that is the first condition we have for the daily scan (previousBarAbove).
Modified Code for Hourly
So now we have this for the hourly scan:
input factor = 1.5;

input length = 20;

input price = close;

def shift = factor * Average(TrueRange(high, close, low), length);

def average = ExpAverage(price, length);

def Avg = average;

def Upper_Band = average + shift;

def Lower_Band = average – shift;

def previousBarAbove = low[1] > Lower_Band;

def piercingBar = open > Lower_Band and low < Lower_Band and close > Lower_Band;

def belowLowerBand = high < Lower_Band;

plot scan = previousBarAbove and piercingBar and Highest(belowLowerBand[1], 14) > 0;
What the Heck is That?
I will take some time to explain. I have only added one line of code. It evaluates to True when the high of a bar is below the lower band. Which means it is completely outside of the Keltner channel, below the lower band. This true/false variable, converts to a numeric value of 1/0 automatically. So we only need to check of that variable has been true (value == 1) within the last 14 bars (excluding the current bar). We do this using a method named Highest(). This checks for the highest value of the variable within the last 14 bars. We just need to have one of those bars to be true (value == 1) in order to tigger that condition.
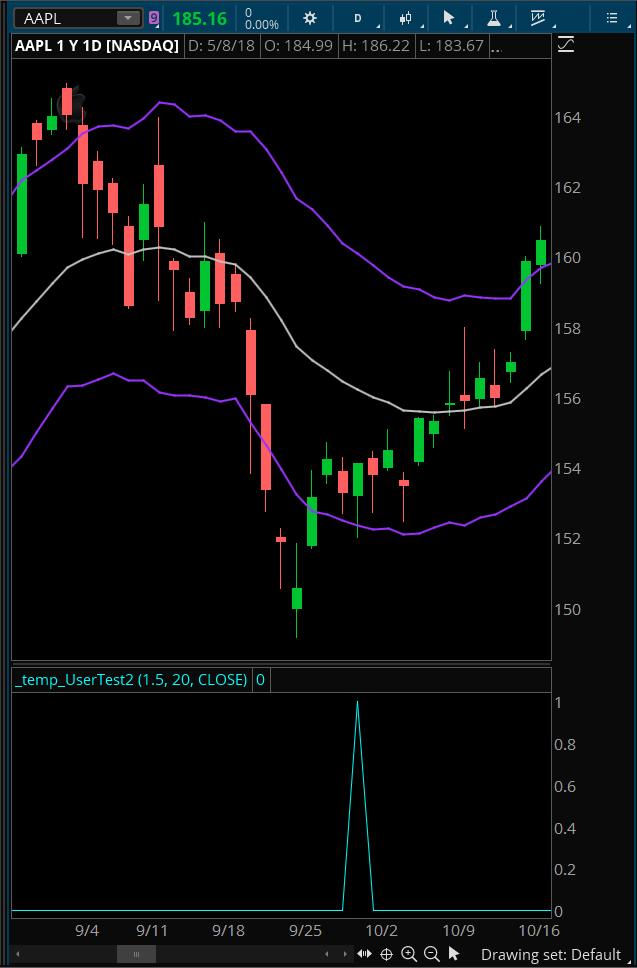
Third screenshot shows the result. I left the chart set to daily because it makes it easier for folks to go back and check their own charts. This pattern will be detected on any time frame you apply it to.
Have fun!
We don’t usually permit additional questions be posted using the “Post your Answer” box at the bottom of the thread. It is usually best to respond to previous questions by entering a comment, as I have done here. However the question you added here is sort of another answer to your original question. Sort of.
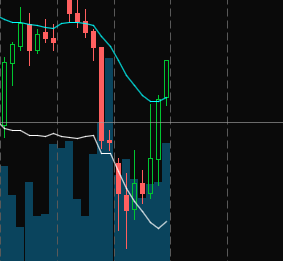
I see you included a screenshot but I don’t see the full chart. So I don’t have the ticker symbol and cannot replicate the chart on my side. Your screenshot is also lacking any indication of the exact bar on the chart that contains the signal you are trying to get your code to pick up. So I really can’t do anything with this.
Since you are interested in learning. I suggest you try plotting this code as a lower study, as I did for my screenshots. Then work through each piece of your code, changing the def to plot, so you can see exactly what each one is doing. This is a very important skill in software development (debugging). Programmers spend far more time debugging code then they do writing it.
If you get through all that and still can’t get things nailed down I suggest you post a new question for this hourly scan. Be sure the title of question explains what you are trying to achieve, (such as including the phrase: Keltner breakout bar).
Good luck, and have fun!