| ♥ 0 |
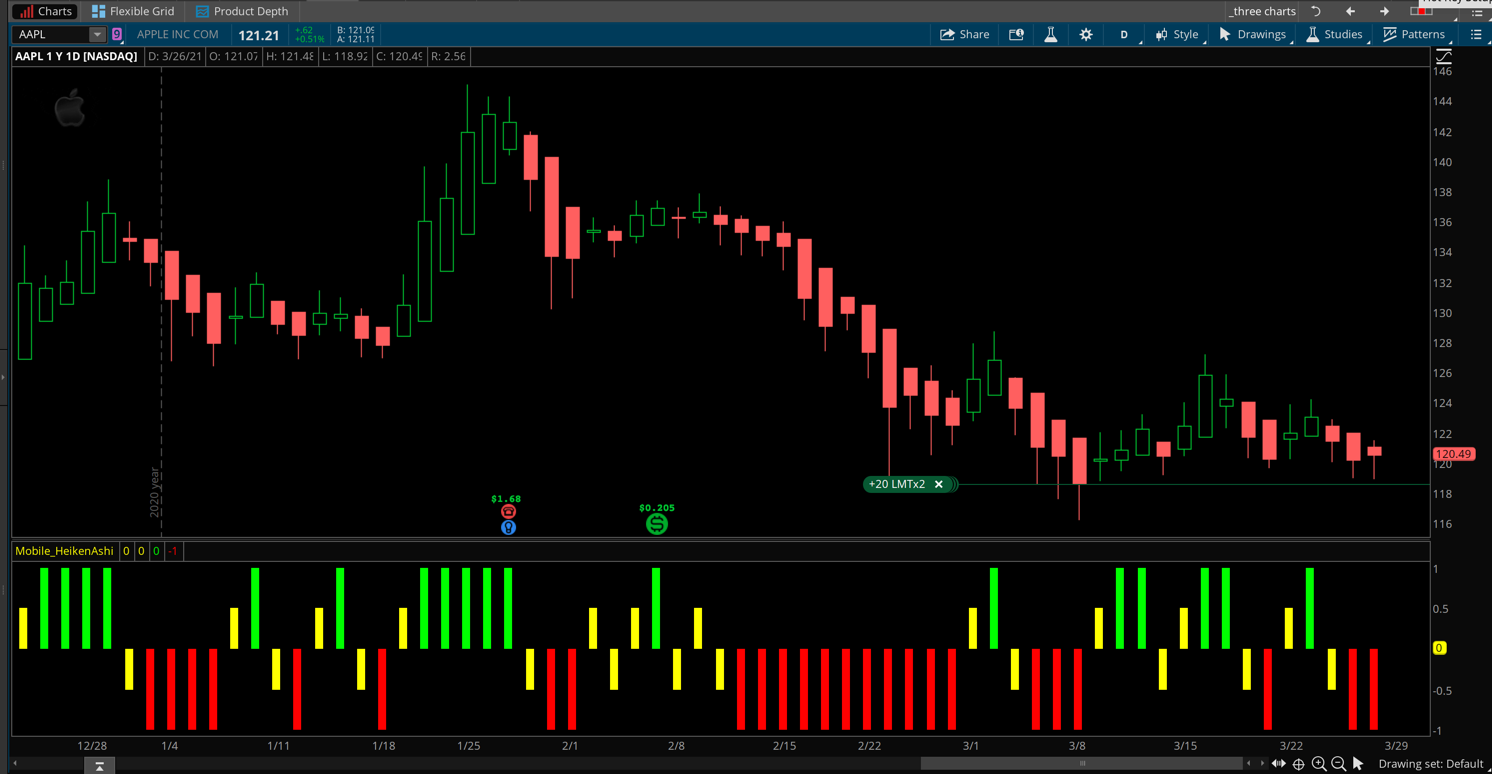
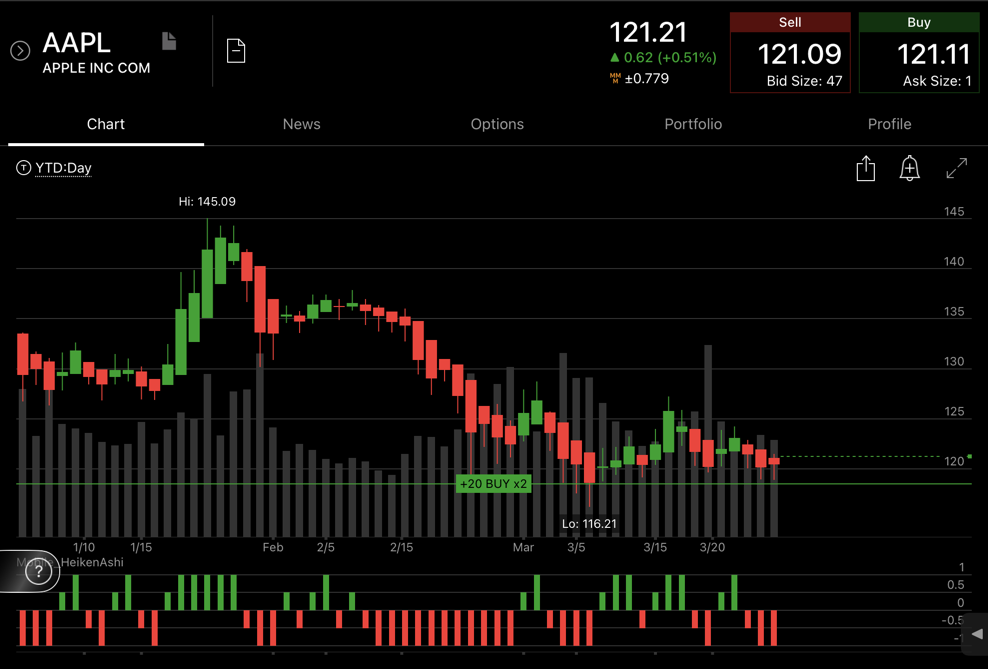
Pete, I’m looking for a lower study that will paint a green dots for a green candlestick and red dot for a red candlestick for the Heikin Ashi candlesticks….Then when it goes from red to green or green to red on the first candlestick it will paint a yellow dot…..Then go to either red or green dots… Attachments:
Marked as spam
Asked on March 26, 2021 1:54 pm
885 views
|
|
Private answer
In order to complete this within the 15 minutes I allow for free solutions I provide free of charge in the Q&A Forum I will borrow the code from a previous post: https://www.hahn-tech.com/ans/heikin-ashi-on-thinkorswim-mobile-app/ Please take the time to review the details on that post so you understand the original source of this code. The only change was to fascilitate the yellow bars for first green and first red Heiken-Ashi candles in each series. In keeping with the original post I have designed this work on both the desktop version of Thinkorswim as well as the mobile app version. From the screenshot below you see that color of histogram bars cannot be changed. They will always display green when above zero and red when below zero. So in order to make the first green and red bars stand out from the rest those bars are shorter. On the desktop version those bars are yellow as requested.
Attachments:
Marked as spam
Answered on March 27, 2021 1:01 pm
|