| ♥ 0 |
I have an inside bar indicator I love to use but I was looking for some help in only showing the bar when the RSI is overbought or oversold. I hope this is quick and easy and I always appreciate all the help!
#hint: double inside day – next day look for the price to move big one way or another… def insideBar = if hi[1] >= hi and lo[1] <= low then 1 else 0;
Marked as spam
|
|
Private answer
I updated the title of your question to better reflect the context of your request and correct a typo. I built my own solution from scratch rather than using the code you provided as an example. That code contains some elements which I avoid including in my own solutions. For example there is absolutely no need to create variables for the high and low.
That is just a wasted step and complicates the code, making it more difficult to read. In a script of this size that is a minor issue. But when building scripts of several dozen lines of code it becomes a royal pain. Please don't take that as a criticism. Folks visiting this forum are trying to learn and I want them to learn how to do the fundamental steps correctly. It's very difficult to correct this type of behavior once it becomes a habit. (I had to learn this myself and wish the examples I original learned from were done correctly). Before providing my solution I will demonstrate how a section of your code can be reduced down to a signal line, and as a result, it much easier to read and maintain:
Now here is the exact same result written in a single line of code:
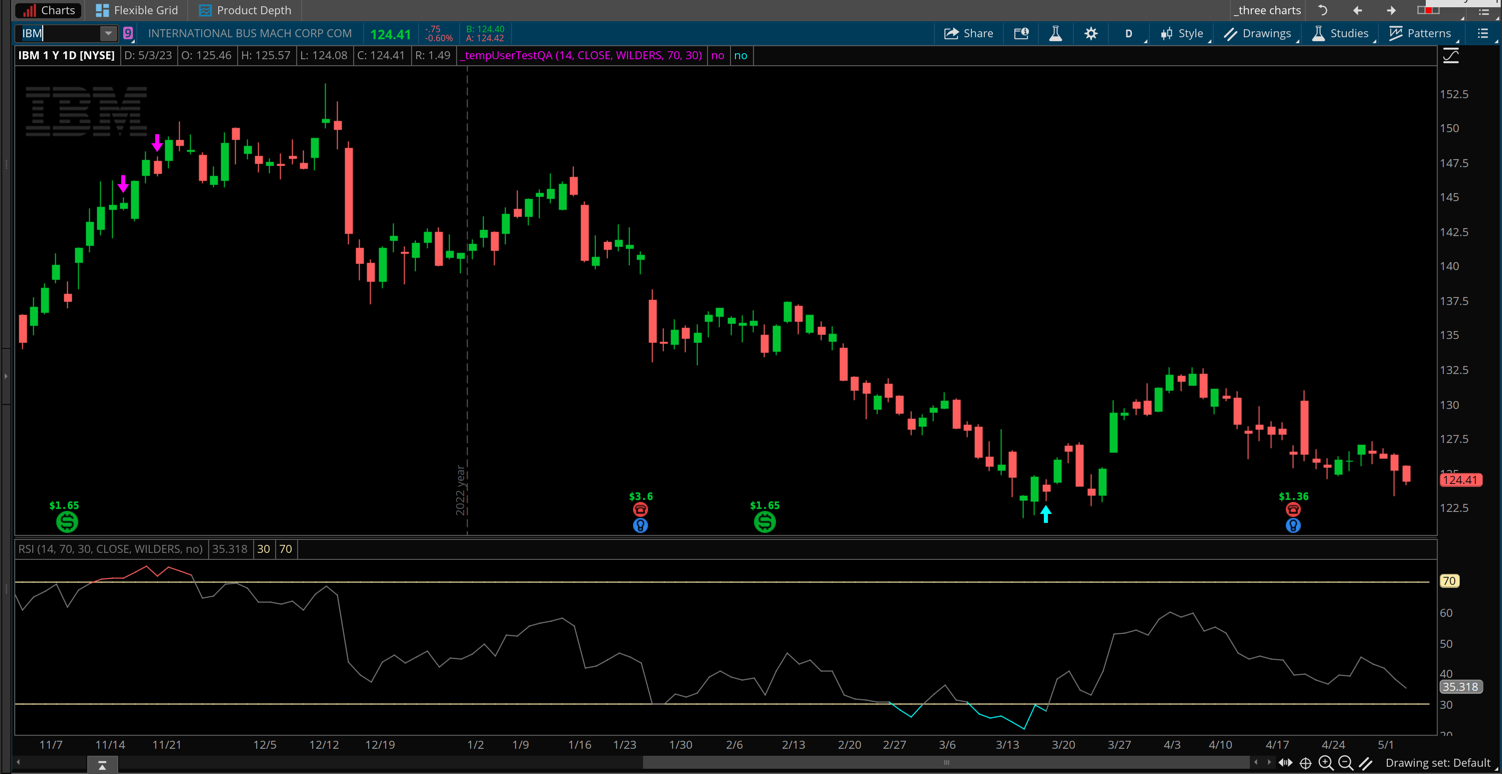
There you go, hope that helps you see the differences between these two approaches. Now on to the solution. Here is a new chart study with the RSI and the inside bar components, blended together to plot signals on the chart:
There are user inputs for all of the RSI parameters and I have separated the signals to make is easy to see which ones are oversold and which ones are overbought. Screenshot below shows the result. The RSI on the lower subgraph is not needed, but was included to demonstrate the way the code is handling these patterns. Attachments:
Marked as spam
Answered on May 3, 2023 9:44 am
|