Market Breadth Indicator For Swing Traders


Category:
0
0

Hi Pete,

There is a basic breadth indicator available in other platforms that I was surprise TOS did not have. This indicator is great primarily for swing traders, it gives a very good idea when stocks are overheated and possibly ready for a pullback. On the other side can also alert of extreme oversold conditions.

The indicator plots the percentage of NYSE stocks above the 40-day period MA. I assumed is simple moving average.

Is this something that can be code for Thinkorswim?

There is an screenshot below of what it looks like.

Thank you


Attachments:
RESOLVED
Marked as spam
Posted by (Questions: 3, Answers: 5)
Asked on April 25, 2017 5:24 pm
1518 views
0
Private answer

Regardless of the platform this is not something that is created by writing a custom indicator. The list of NYSE stocks is nearly 1,700 long. The indicator would have to include each and everyone of them. Your computer would explode.

I just ran a scan for NYSE stocks above their 40 day simple moving average and I get a grand total of 976. That’s the closest you are going to get on Thinkorswim until they decide to add this as one of the indexes they provide. You are encouraged to submit this as a feature request. Just be sure you understand this is not a chart based study. This is a compiled index.

My own thoughts on the subject. Being a person very keen to understand the quality of data analysis and not just the quantity. I seriously question the efficacy of such a broad scope index. Out of some 1,697 stocks (currently) there is bound to be a ton of dead wood in there. (6% are currently trading under $5 a share) Which would tend to muddy the water, in my opinion.

Along these same lines, what is the predictive value of such a broad scope index? When one considers the number of stocks that are not present on the current list compared to say, 2007? 1999? 1987? And the flip side of that, how many new stocks have been added since any of these historic dates?

I certainly didn’t intend to trash your idea. It’s a great question and I only seek to make sure you and future viewers of this post consider the deeper meaning of some of the most commonly used metrics. There is a lot of snake oil out there.

Marked as spam
Posted by (Questions: 37, Answers: 4084)
Answered on April 25, 2017 7:51 pm
0
Private answer

Hi Pete

Thank you for the reply. I didn’t know this was an index that was set up by the platform and it is not something you can write a code for and make it an indicator.  It is good to know the difference thanks again for the information.

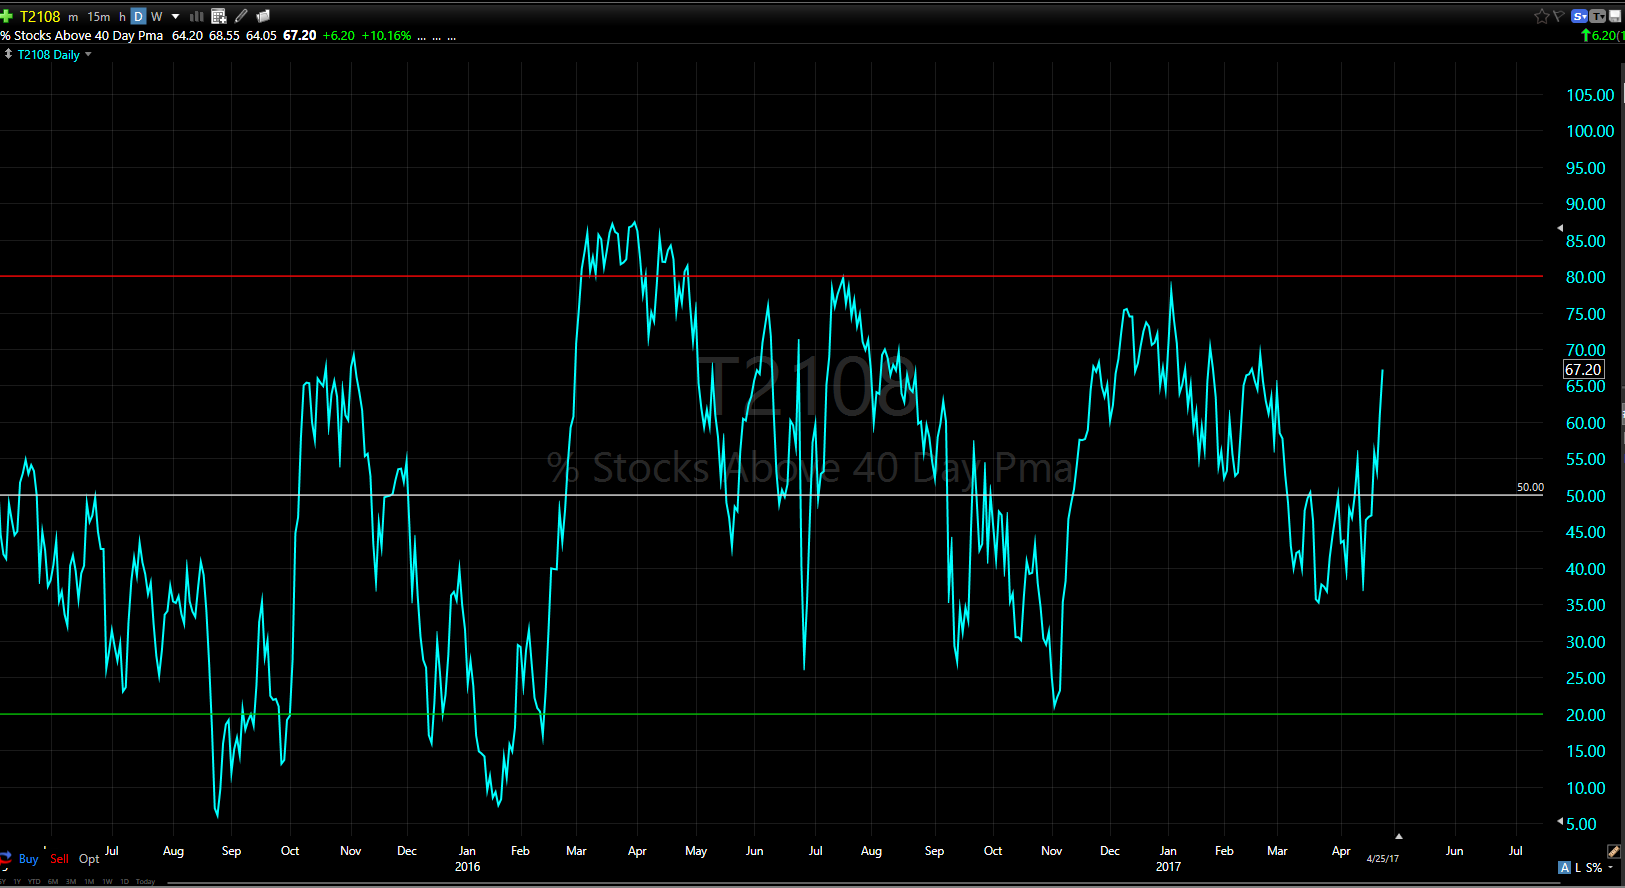
In regards to the usefulness of the index itself I have to strongly disagree with you. By any means this is not a day trading tool but it is very useful if you are a swing trader. I do trade momentum stocks for a living. I hold anytime from 2-days to a few weeks. The tool helps me determine the best time to push on the gas and take breakouts on strong stocks,  this is true when the tool is below 20. It al so tell me when the move is getting extended and I should tighten my stops on open positions.

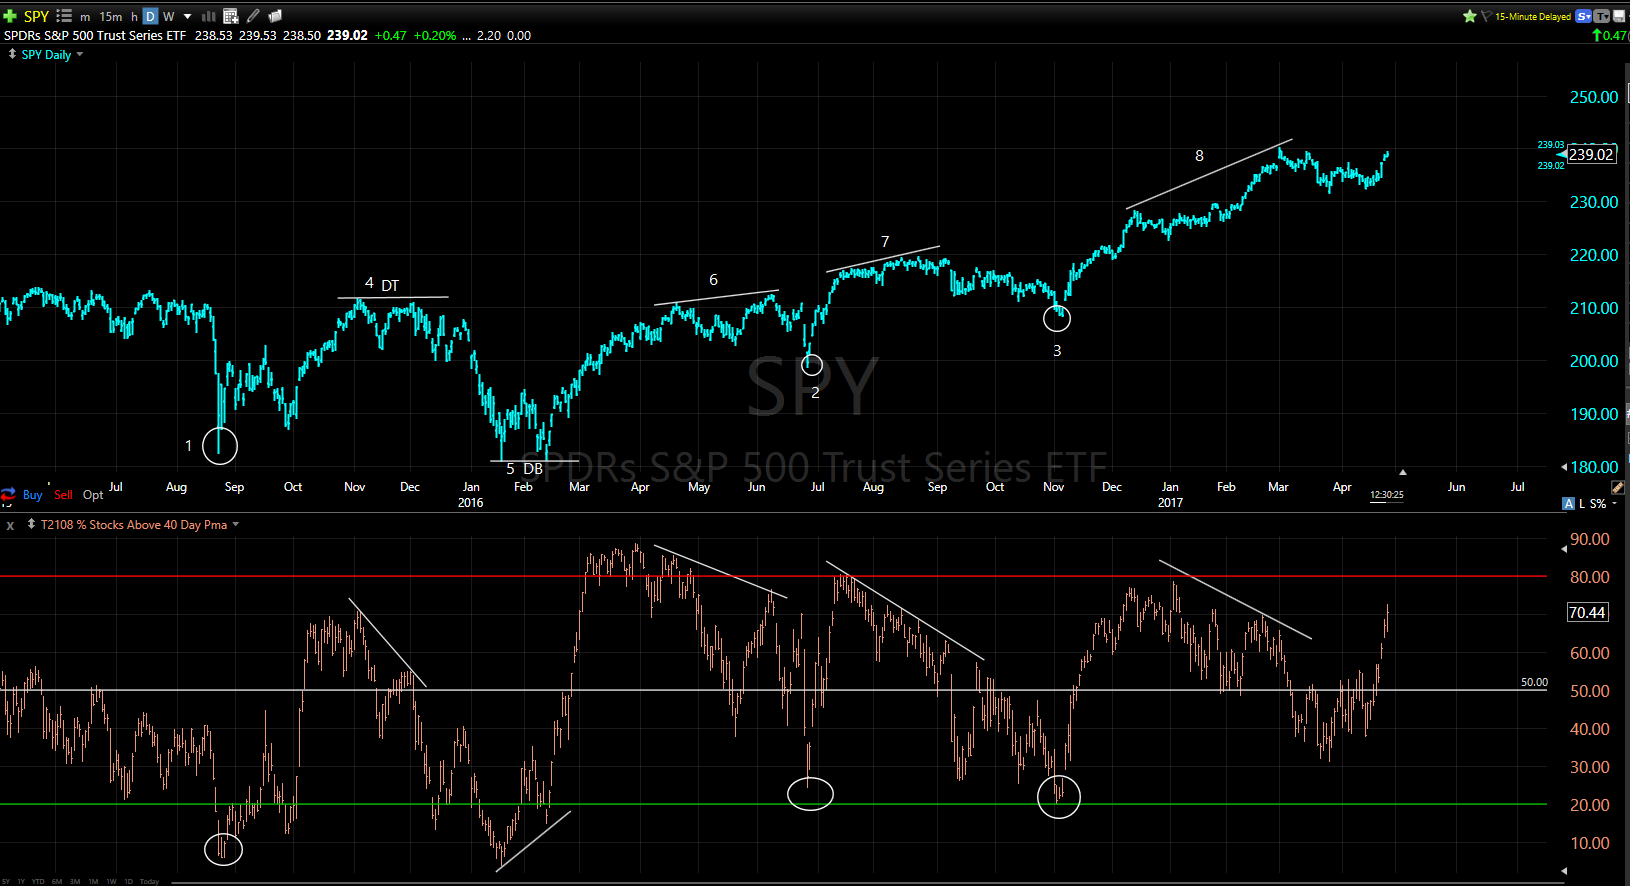
Please see the below chart of over a year of data, I marked how I use the tool and its applications for swing trading. Also as information from anyone reading your blog.

1 August 2015 the index was below zero for a few weeks. This was the time to scan for strong stocks that were consolidating near 52-week highs or fighting the overall market correction.

2 The index didn’t make it all the way to 20 but it came close. Same concept keep a close eye on strong stocks consolidating near highs.

3 The index touch 20 just before reversing.  The point is every time the index goes below 20 or near 20 it is overdone on the downside and  the odds are high a rally it is just around the corner. Therefore it is the time to pay close attention to stocks consolidating near highs because this stocks will be the first to rocket to the upside once the market has bottomed.

4 SPY formed a double top while index shows a strong bear divergence. Tighten stops on open positions and take profits on stocks that are way extended from the 20-day ma.

5 SPY Double Bottom while index was not only below 20 but also formed a bullish divergence. Great buying opportunity for the whole year.

6 SPY moving higher, index negatively diverging. sell extended positions and tighten stops.

7 and 8 same as 6.

Attachments:
Marked as spam
Posted by (Questions: 3, Answers: 5)
Answered on April 26, 2017 10:45 am
0

Probably another great example of why I am not a profitable trader. I did a quick Google search and found there are other versions of this published by various entities.

Here is one that I found: http://www.indexindicators.com/charts/nyse-vs-nyse-stocks-above-50d-sma-params-3y-x-x-x/

Hahn-Tech, LLC has no affiliation to this site and cannot vouch for it’s accuracy or efficacy. Use at your own risk.

( at April 26, 2017 3:41 pm)