Move VALUES_ABOVE further away?


Category:
0
0

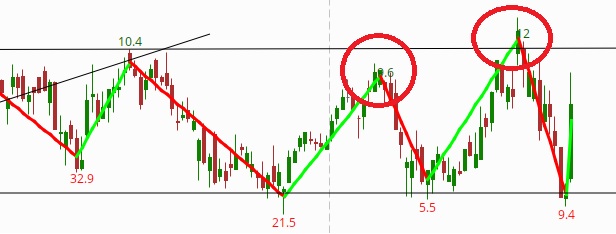
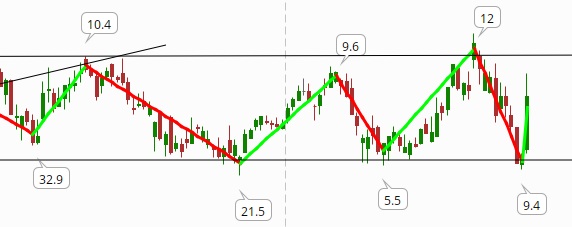
Hi Peter. Is it possible to move VALUES_ABOVE and VALUES_BELOW further up or down from the graph?  Or move it sideways?  I’ve used it on a zig-zag wave showing volume on each wave, but sometimes the values are being overwritten by the graph.

uVol.SetPaintingStrategy(paintingStrategy.VALUES_ABOVE);


Full code:

declare upper;

input price = hlc3;
input reversalAmount = 1.5;
input reversalMode = {default price, percent};
input displayMode = {default volume, barNumber, barTotal, none};
input multiplier = 1;

def mode = if reversalMode == reversalMode.price then ZigZagTrendSign(price = price, reversalAmount=reversalAmount) else ZigZagTrendPercent(price = price, reversalAmount=reversalAmount);
def inflection = if reversalMode == reversalMode.price then if !isNan(ZigZagSign(price = price, reversalAmount=reversalAmount)) then 1 else 0 else if !isNan(ZigZagPercent(price = price, reversalAmount=reversalAmount)) then 1 else 0;
rec trend = if inflection==1 and mode ==-1 then 1 else if inflection==1 and mode==1 then -1 else trend[1];

plot wave = if reversalMode == reversalMode.price then ZigZagSign(price = price, reversalAmount=reversalAmount) else ZigZagPercent(price = price, reversalAmount=reversalAmount);
wave.EnableApproximation();
wave.AssignValueColor(if trend[1] == 1 then color.green else color.red);
wave.SetLineWeight(3);

rec upWaveVolume = if inflection == 1 and trend == 1 and close > open then volume else if inflection == 1 and trend == 1 and close <= open then 0 else if trend == 1 or (inflection == 1 and trend == -1 and close >= open) then upWaveVolume[1] + volume else 0;
rec downWaveVolume = if inflection == 1 and trend == -1 and close < open then volume else if inflection == 1 and trend == -1 and close >= open then 0 else if trend == -1 or (inflection == 1 and trend == 1 and close <= open) then downWaveVolume[1] + volume else 0;

rec barsUp = if inflection == 1 and trend == 1 and close > open then 1 else if inflection == 1 and trend == 1 and close <= open then 0 else if trend == 1 or (inflection == 1 and trend == -1 and close >= open) then barsUp[1] + 1 else 0;
rec barsDown = if inflection == 1 and trend == -1 and close < open then 1 else if inflection == 1 and trend == -1 and close >= open then 0 else if trend == -1 or (inflection == 1 and trend == 1 and close <= open) then barsDown[1] + 1 else 0;

plot uCount = if (displayMode == displayMode.barNumber and barsUp) then barsUp else double.nan;
uCount.SetPaintingStrategy(paintingStrategy.VALUES_BELOW);
uCount.SetDefaultColor(color.dark_green);

plot dCount = if (displayMode == displayMode.barNumber and barsDown) then barsDown else double.nan;
dCount.SetPaintingStrategy(paintingStrategy.VALUES_ABOVE);
dCount.SetDefaultColor(color.red);

plot uCountTot = if (displayMode == displayMode.barTotal and barsDown == 1 and barsUp==0) then barsUp[1] else double.nan;
uCountTot.SetPaintingStrategy(paintingStrategy.VALUES_ABOVE);
uCountTot.SetDefaultColor(color.dark_green);

plot dCountTot = if (displayMode == displayMode.barTotal and barsDown==0 and barsUp==1) then barsDown[1] else double.nan;
dCountTot.SetPaintingStrategy(paintingStrategy.VALUES_BELOW);
dCountTot.SetDefaultColor(color.red);

plot uVol = if (displayMode == displayMode.volume and barsDown == 1 and barsUp==0) then Round(“number” = upWaveVolume[1] / 10000000 * multiplier, “numberOfDigits” = 1) else double.nan;
uVol.SetPaintingStrategy(paintingStrategy.VALUES_ABOVE);
uVol.SetDefaultColor(color.dark_green);
uVol.SetLineWeight(1);

plot dVol = if (displayMode == displayMode.volume and barsUp == 1 and barsDown==0) then Round(“number” = downWaveVolume[1] / 10000000 * multiplier, “numberOfDigits” = 1) else double.nan;
dVol.SetPaintingStrategy(paintingStrategy.VALUES_BELOW);
dVol.SetDefaultColor(color.red);


Attachments:
RESOLVED
Marked as spam
Posted by (Questions: 1, Answers: 1)
Asked on March 7, 2022 2:05 am
76 views
1
Private answer

No, this it is not possible to move them further away from the high and low of the candle on which they appear.

Yes, it is sometimes possible to shift them one or more bars to the right or left. But you did not include any of the code you are using to place these values on the chart so I cannot provide any suggestions on how to adapt your specific code to accomplish this.

I suggest you learn to use the AddChartBubble() statement since this allows you full control over the placement of each chart bubble and the values which are displayed.

https://tlc.thinkorswim.com/center/reference/thinkScript/Functions/Look---Feel/AddChartBubble


Marked as spam
Posted by (Questions: 37, Answers: 4089)
Answered on March 7, 2022 7:52 am
0
Thank you for your reply, and for the suggestion of looking into AddChartBubble(). I have updated the question with the full code and an example. I will look into AddChartBubble to see if I can move the values left.
( at March 9, 2022 3:47 pm)
0
Success! Thanks, that’s what I needed. I modified the plot uVol and plot dVol lines as follows to get the values further away. Added a pic of the new graph, which is what I wanted. (Would be nice to be able to toggle the bubble outline on/off.) def uVol = if (displayMode == displayMode.volume and barsDown == 1 and barsUp == 0) then Round(”number” = upWaveVolume[1] / 10000000 * multiplier, ”numberOfDigits” = 1) else Double.NaN; AddChartBubble(uVol, high + 0.5, uVol, Color.WHITE, yes); def dVol = if (displayMode == displayMode.volume and barsUp == 1 and barsDown == 0) then Round(”number” = downWaveVolume[1] / 10000000 * multiplier, ”numberOfDigits” = 1) else Double.NaN; AddChartBubble(dVol, low – 0.5, dVol, Color.WHITE, no);
( at March 9, 2022 4:29 pm)
0
Congratulations! Thanks for taking the time to come and update your post with the new solution you created based on my suggestion. There is now way to remove the outline of the chart bubbles in the current version of Thinkorswim.
( at March 9, 2022 4:52 pm)