| ♥ 0 |
I am trying to automate some of my work. On my pre-market checklist grid. I want to plot the open price on the first day of the year and stay(not change throughout the whole year for the e-mini or any market I monitor. I got the month to work. Can’t get the year it always wants to plot the Jan 3rd price. Here is what I have got so far. Thanks for your assistance Kevin
input yearOpen = 2240.75; AddLabel(showLabel, ” Year Open ” + GetDay()[evaluateBar] + ” Open ” + yo + ” “, Color.PLUM); plot openY = yo;
Attachments:
Marked as spam
|
|
Private answer
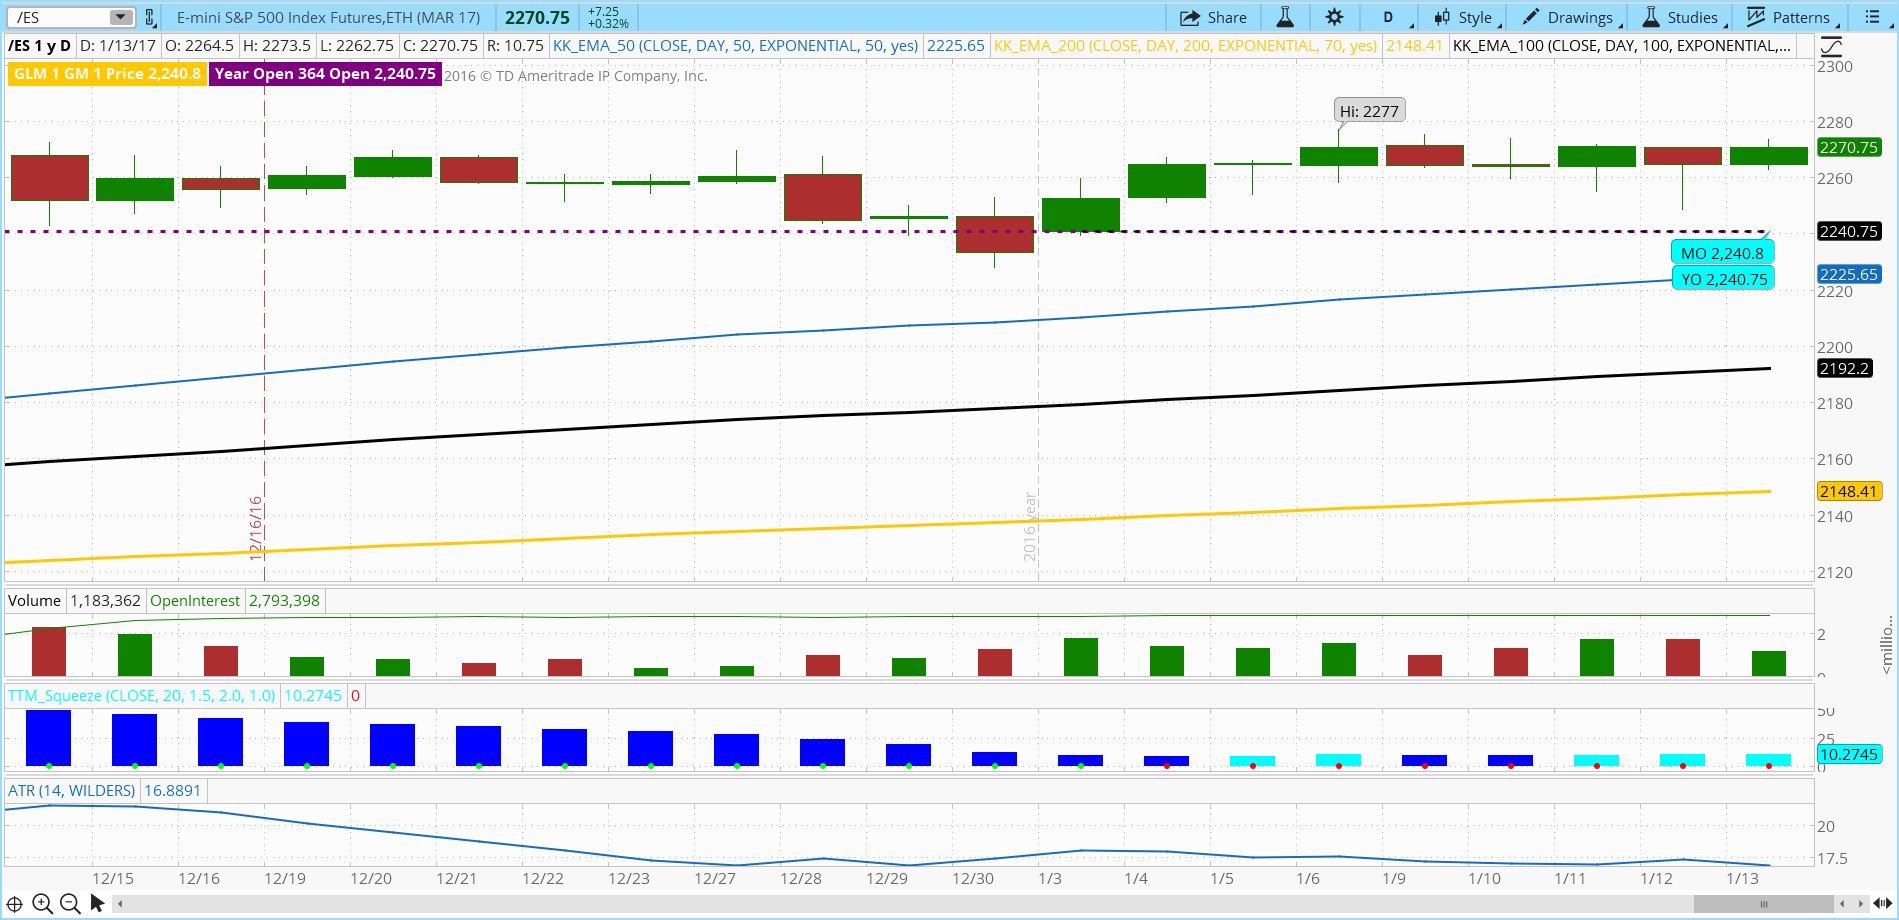
I have a couple of comments. One is that the code you posted produced numerous compiler errors. So I started from scratch. Not a perfect solution because mine is plotting the daily close for all years prior to the current year. But for the current year it does indeed plot the Opening price for 2017, which is January 3rd. For the symbol /ES, that value is 2240.75.
Hope it helps! Marked as spam
Answered on January 13, 2017 8:33 pm
|