| ♥ 0 |
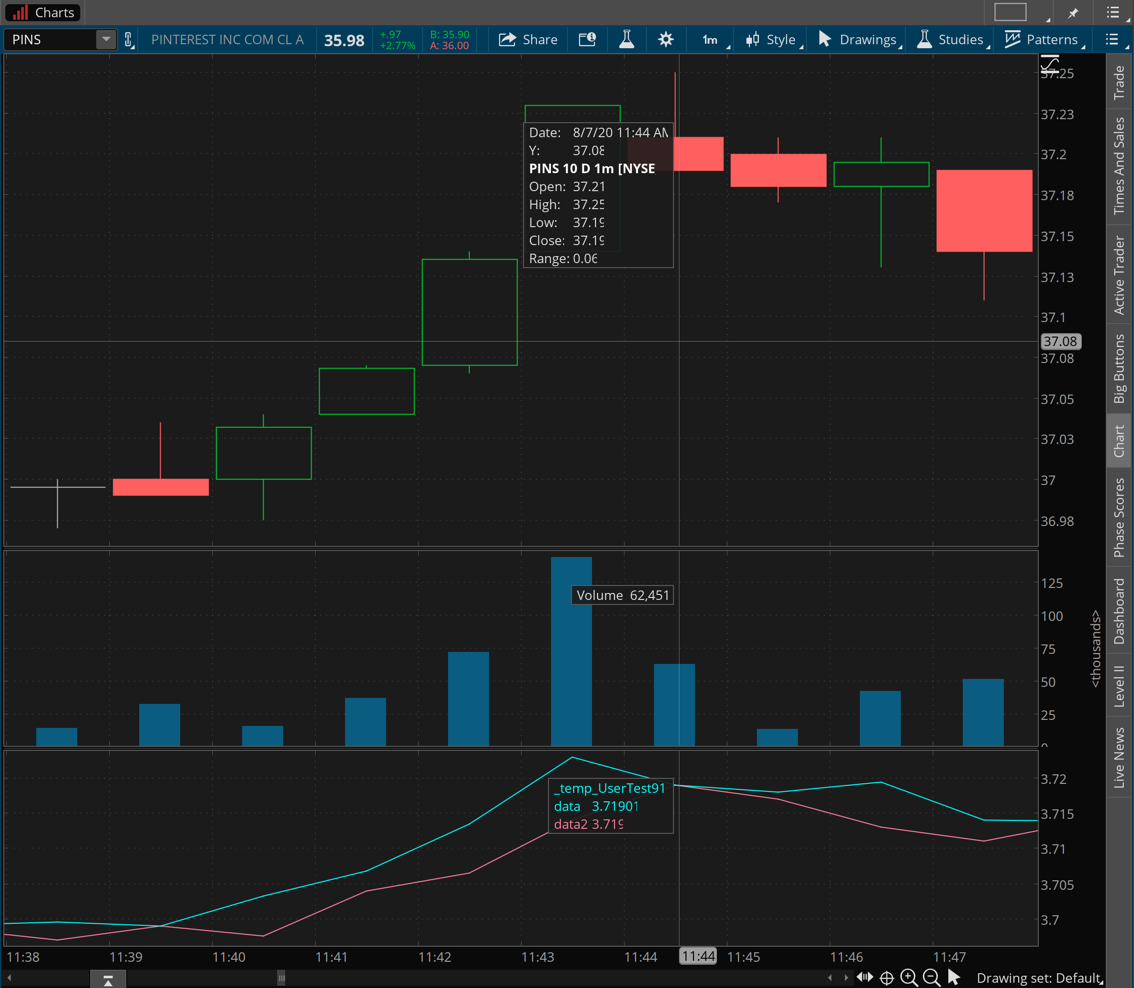
Hi, I know there’s a shooting star study available in the wizard, but I need one that will alert me based on one candle only, without considering the previous candle like the standard shooting star study does. I’m able to hit some of the shooting stars, but it’s bugging me why this one is not firing. See screenshot, white arrow pointing to problematic candle. This one is just before a selloff, one which should be firing and alerting me! Please advise! Attachments:
Marked as spam
|
|
Private answer
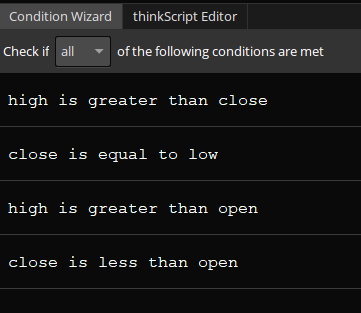
Based on further details provided in the comments section of my original answer I understand exactly what it taking place here. The code is working exactly as it was designed. The problem is that many stocks today are still trading in fractions. Many fractional values cannot be accurately displayed on the chart, where prices are rounded to the nearest penny. How do we discover this? First is to break the code apart into individual pieces. The most likely failure point is "the close is equal to the low". So we create a chart study to test this:
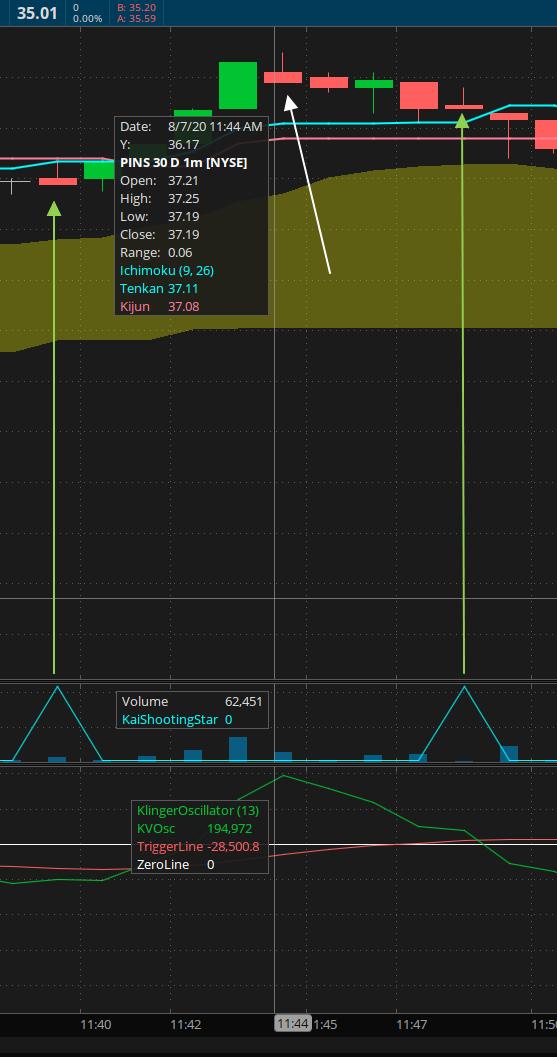
When plotted on the section of the chart in question we find it returns false for candle you marked with a white arrow. Even though the values displayed on the chart seem to be exactly equal. Rest assured, they are not. Otherwise that line of code would evaluate to true for that candle. The next trick is to discover a way to display the true value for the close and low of that candle. This is magic:
You don't learn to look for stuff like this or how to uncover the truth without having spent several years writing custom code for others. So don't feel bad that you totally missed this. Screenshot below shows the chart with this study applied. Notice the values of the red and blue lines. Off by only the smallest amount. Real value of the close is 37.1901 while the real value of the low is 37.1900. Just missed it. Now that we understand what is happening, how on earth do we fix this? We apply rounding so that the two values will always match exactly when they are within less than a penny of each other.
Attachments:
Marked as spam
Answered on August 18, 2020 1:36 pm
|
|||||
|
Private answer
Imagine trying to examine an elephant by peering through a microsope. That's exactly what it's like to try to get the full context from your screenshots. I see almost everyone doing this but for the life of me I have not understood why folks insist on presenting a small fraction of the detail in their screenshots. There are details on the rest of the screen that must be checked before the true cause of the problem can be uncovered. Context. How can I replicate your conditions on my side to test things out and uncover the cause without context? I cannot see the ticker symbol selected for your chart. I cannot see the time frame. I cannot see the time frame selected for your conditional order. I cannot see any of the details that are the most important. Try posting a gain and this time don't leave out all of the most important details. Marked as spam
Answered on August 18, 2020 8:47 am
|