New High/Low time stamp alert


0
0

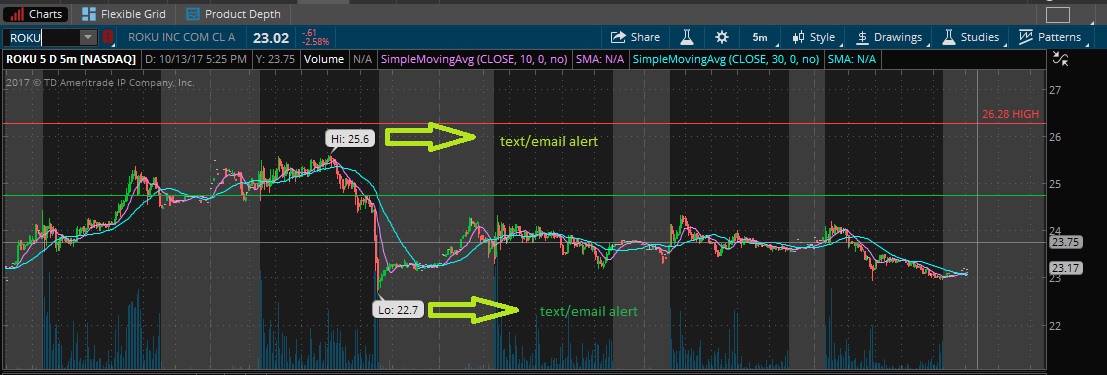
Hi, i’m going to try this here since I’ve posted everywhere with no luck.  Was wondering if it was possible to receive a text alert when the chart makes a new high or a new low on a specific time frame.  I’ve provided an example.  It would make my life so much easier instead of going through every stock to find the new high and the new low.  Any ideas?

Attachments:
Marked as spam
Posted by (Questions: 5, Answers: 12)
Asked on October 14, 2017 12:41 pm
714 views
0

Hi Adrianna, glad you were able to persevere and learned how to post in our Q&A forum. Before providing a solution I have to explain a few things. To send text alerts, we can do that using either a Study Alert or a Dynamic Alert. The Study alert must be applied to a single stock ticker. If you want to receive alerts when this condition occurs across a large list of stocks, we must use a Dynamic Scan. The first step is the create the scan, then save that scan. Only once it has been saved will you be able to create a dynamic alert from the saved scan. We explain how to do this towards the end of this video: https://www.hahn-tech.com/thinkorswim-overnight-range-scan-alert/

So be sure to watch this video, beginning at the 23:50 time stamp, which is where I demonstrate how to create the dynamic alerts. You will need to know how to do this part before you can make use of the solution I provide.

Ok, now I have some questions to make sure I understand your goals. When you say “when the chart makes a new high or a new low on a specific time frame”, it is very important we know what that means. From your screenshot I see you are plotting 5 days worth of 5 min bars. So do you only want to check for new high/low within the previous 5 days of trading data? Or do you have some other span of time you want to check? That chart can easily be changed to display 15 days of 15 min bars, dramatically changing your results. Will you only use this on a 5 min time frame or do plan to apply this to other time frames too?

I think that should do it.

( at October 14, 2017 2:56 pm)
0
Thank you for the reply. Saw the video like you told me to and i understand how to make an alert at least i think i know. I would like to get alerted for the 5 day 5 min time frame when the chart reaches a new high and a new low within that 5 day time period. Thank you so much ahead of time ?
( at October 23, 2017 6:38 pm)
0
Private answer

Well I have not heard back from Adrianna. I have posted a response to this very topic under a previous request in the forum. Anyone searching for a solution to this one should view my response here: https://www.hahn-tech.com/ans/tos-scanner-for-new-high-intraday/

Keep in mind that solution provided above can only scan for new high/low during current trading day. It cannot look back any further. If Adrianna ever gets back to use with clarifications on the items I requested, we can work out a more detailed solution for her.

Marked as spam
Posted by (Questions: 37, Answers: 4084)
Answered on October 19, 2017 11:20 am
0

i believe that i did answer you. Oct. 23 at 6.38 pm. I told you that i would like to get alerted for the 5 day 5 min chart. It’s there i’m seeing it.

( at October 24, 2017 11:50 am)
0

Don’t get confused. Check the dates. My statement that I had not heard back from you was posted on Oct 19th, four days before you replied.

( at October 24, 2017 11:53 am)
0
Private answer

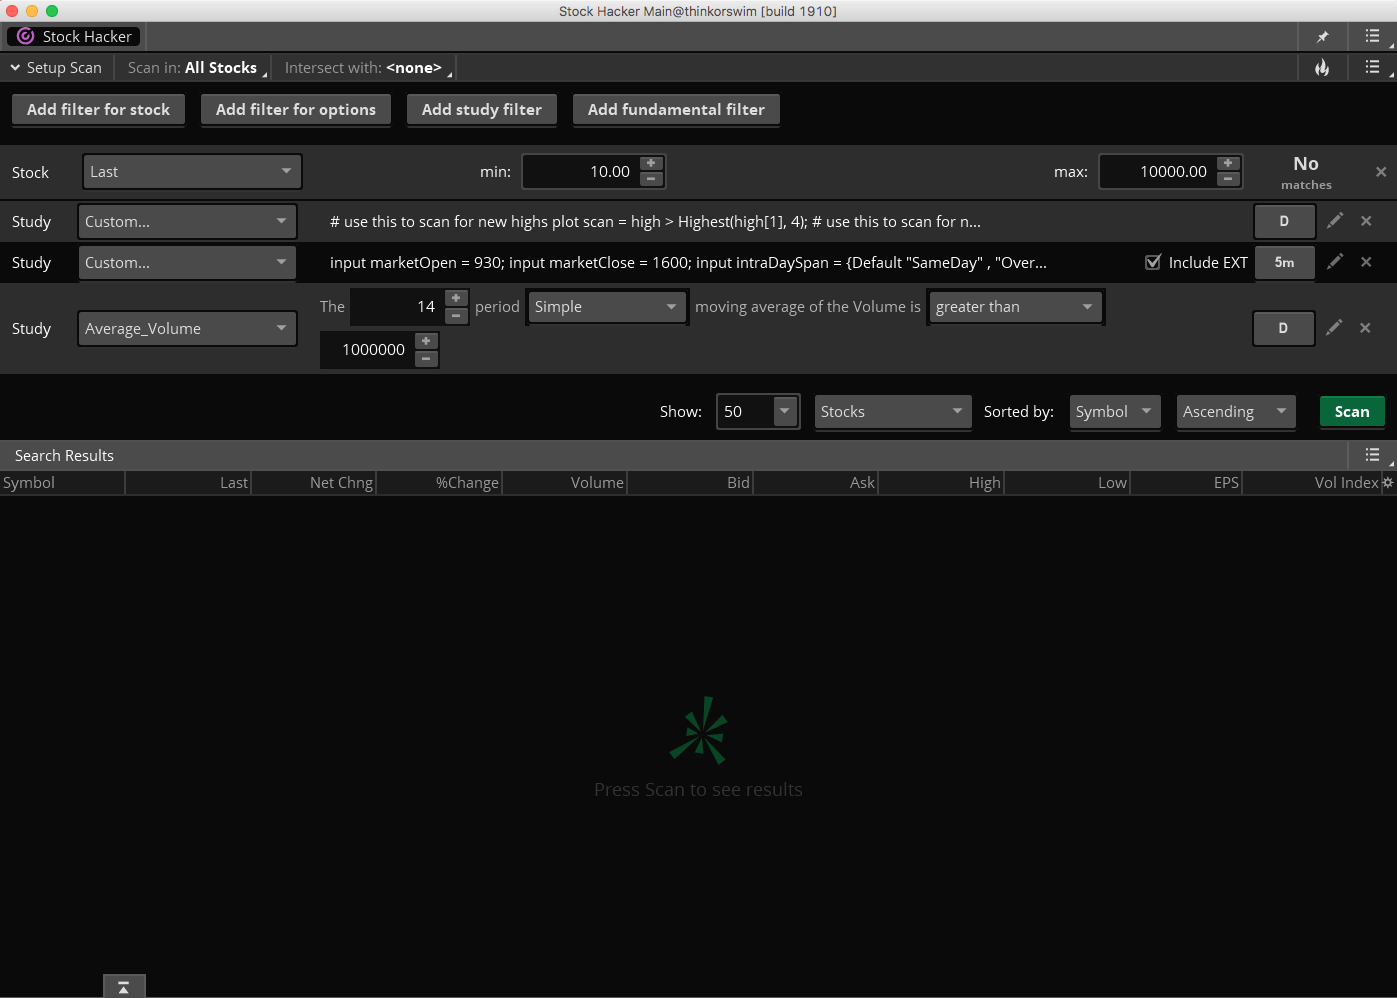
Ok, so the request is to build a scan that checks if there is a new intraday high or low within a 5 day period. The simplest solution I can think of at the moment is to use a two stage scan.

Stage One: Daily

Stage one would be set to a daily time frame. This would check the last 5 daily bars to see if the current day has a higher high or a lower low than any of the previous 4 days.

Stage Two: 5 Min

In stage two we then apply the solution I provided here: https://www.hahn-tech.com/ans/tos-scanner-for-new-high-intraday/ .Which will run on the 5 min time frame to check if there is a new intraday high/low. Both stages would need to agree on a new high/low before the combined signal could add a ticker symbol to the results.

Code for Stage One

# use this to scan for new highs
plot scan = high > Highest(high[1], 4);
# use this to scan for new lows
#plot scan = low < Lowest(low[1], 4);

You will see we can only check for new high or new low, not both at the same time. Simply move the ‘#’ comment mark to switch between high and low.

Code for Stage Two

Previously posted here: https://www.hahn-tech.com/ans/tos-scanner-for-new-high-intraday/

input marketOpen = 930;
input marketClose = 1600;
input intraDaySpan = {Default "SameDay" , "OverNight"};
input numberOfDays = 1;
input numberOfYears = 0;
def okToPlot = GetLastDay() - numberOfDays <= GetDay() and GetLastYear() - numberOfYears <= GetYear() ; def OpenCounter = SecondsFromTime(marketOpen); def CloseCounter = SecondsTillTime(marketClose); def MarketHours = if OpenCounter >= 0 and CloseCounter >= 0 then 1 else 0;
def beforeMidnight = OpenCounter >= 0 and CloseCounter <= 0;
def afterMidnight = OpenCounter <= 0 and CloseCounter >= 0 ;
def Today ;
def hideChartBubbles ;
rec DailyHigh ;
rec DailyLow ;
switch (intraDaySpan) {
case "SameDay":
Today = if GetDay() != GetDay()[1] then 1 else 0;
DailyHigh = if MarketHours then if high > DailyHigh[1] then high else DailyHigh[1] else high;
DailyLow = if Today then low else if MarketHours then if low < DailyLow[1] then low else DailyLow[1] else low; hideChartBubbles = MarketHours; case "OverNight": Today = 0; DailyHigh = if beforeMidnight or afterMidnight then if high > DailyHigh[1] then high else DailyHigh[1] else high;
DailyLow = if beforeMidnight or afterMidnight then if low < DailyLow[1] then low else DailyLow[1] else low; hideChartBubbles = beforeMidnight or afterMidnight; }; def TodaysHigh = if okToPlot and hideChartBubbles then DailyHigh else Double.NaN; def TodaysLow = if okToPlot and hideChartBubbles then DailyLow else Double.NaN; #Alert(DailyHigh > DailyHigh[1] and hideChartBubbles, "New High", Alert.BAR, Sound.RING);
#Alert(DailyLow < DailyLow[1] and hideChartBubbles, "New Low", Alert.BAR, Sound.RING);
# use this to scan for new intraday highs
plot scan = DailyHigh > DailyHigh[1] and hideChartBubbles;
# use this to scan for new intraday lows
#plot scan = DailyLow < DailyLow[1] and hideChartBubbles;

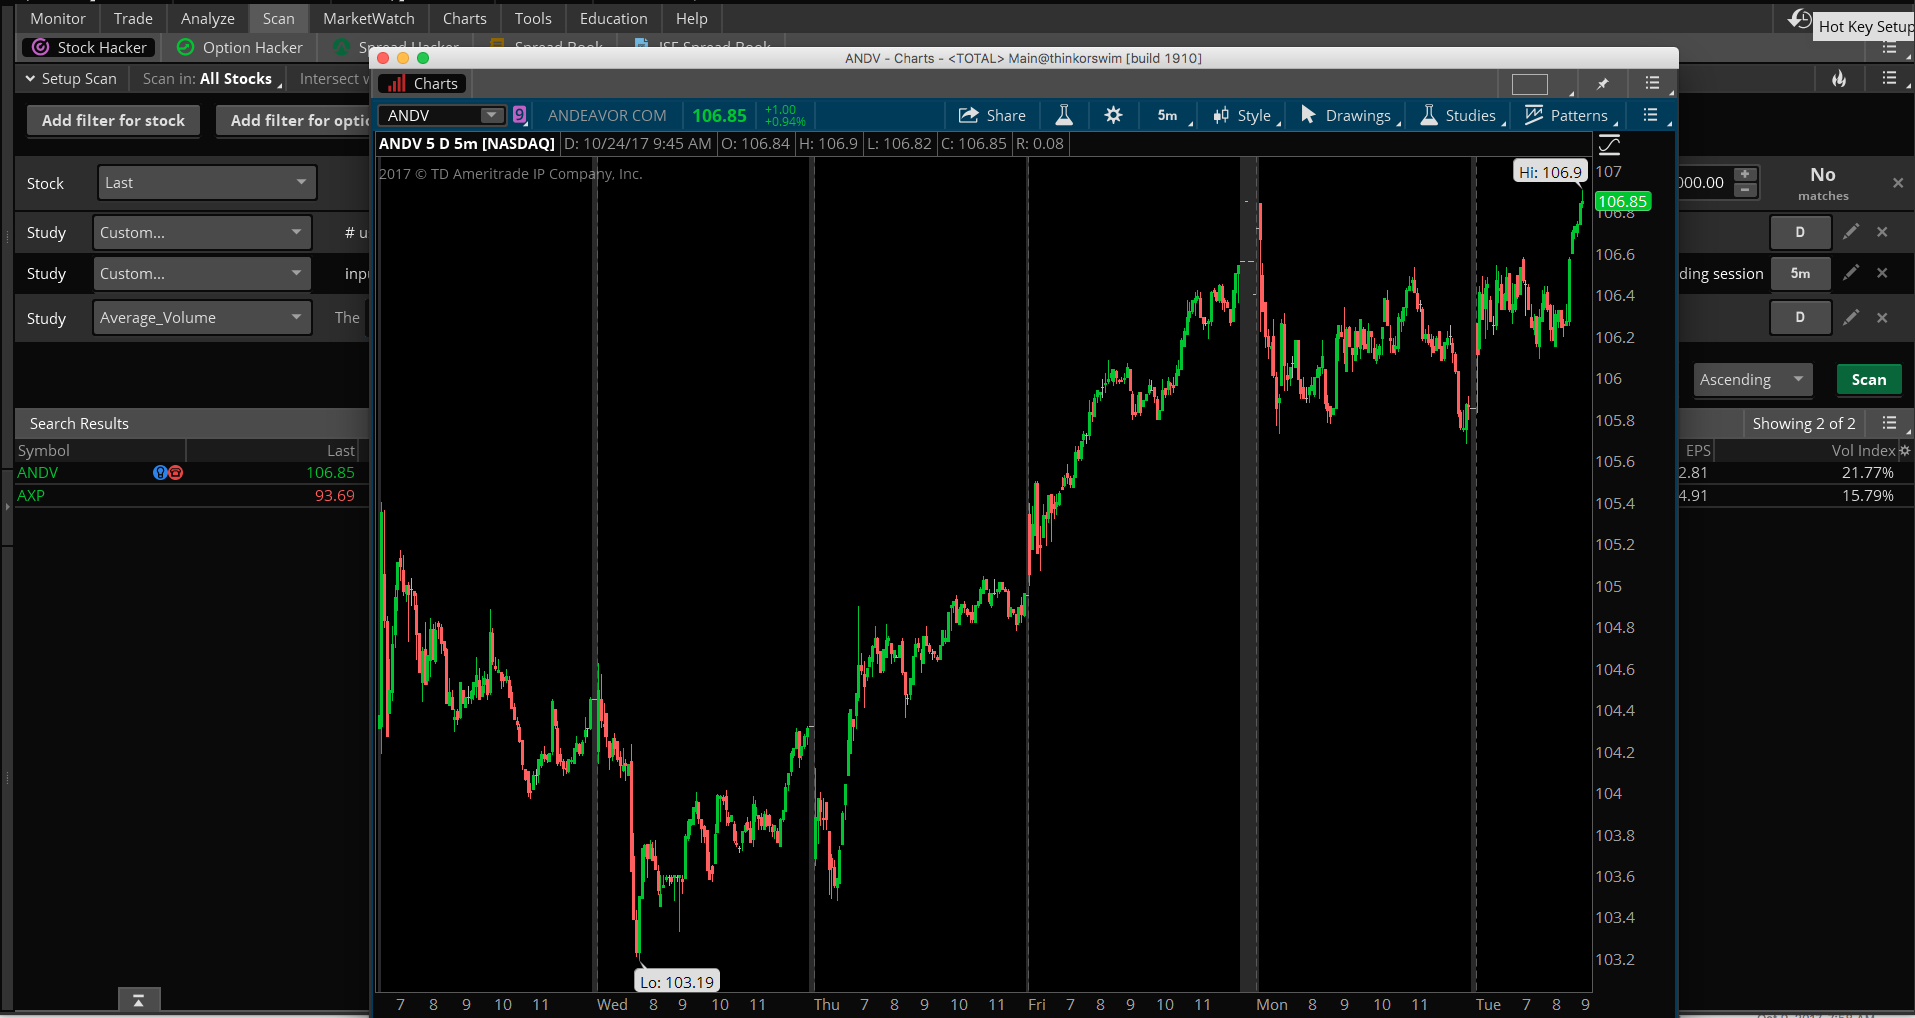
Two screenshots below show scan results for new intraday highs and the layout of the final scan.

Attachments:
Marked as spam
Posted by (Questions: 37, Answers: 4084)
Answered on October 24, 2017 9:48 am
0

so i’m very confused. I know how i can run the scan but the scan gave me these results. How do i apply it to my watchlist??? There’s so much information it’s overwhelming. I added it to my studies but its too small and when i try to make it bigger the graph moves and i can’t play with it. So what am i doing wrong?

( at October 24, 2017 12:28 pm)
0

this is what it looks like when i add it to my study filter. It all shrinks…

( at October 24, 2017 12:30 pm)
0

can’t seem to add an attachment to show you…i don’t know why!!!

( at October 24, 2017 12:32 pm)
0

It is not possible to add screenshots to a comment, so we cannot see your screen. In the beginning you asked for a dynamic alert. Which we have explained would need to be built from a saved custom scan. But now I see you are asking how to apply it to a watchlist. Then I see you added it to your studies, another tangent. Let’s focus on the one thing, build the scan as I demonstrated, then save that scan. Once it is saved, create your dynamic alerts from that scan as shown in the video I linked earlier. None of this code was intended to work in a watchlist or a chart study.

( at October 24, 2017 12:35 pm)