I think this should do the trick. The code keeps track of each day's high and low. Then counts the number of times the high and low have exceeded the previous highest and lowest on the day. New highs are counted as positive integers while new lows are counted as negative integers.
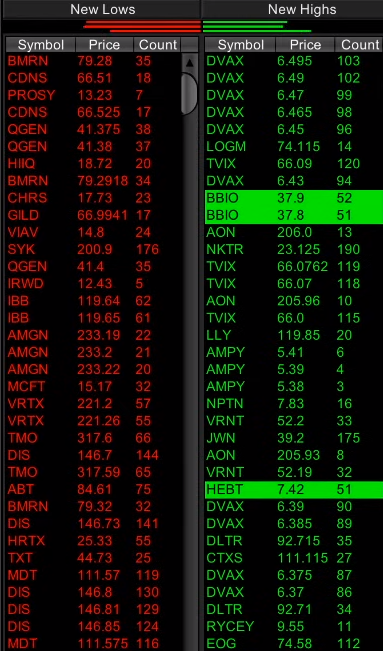
The color scheme is based on those values. Above zero and value is colored red while below zero the value is colored green. Then we have the new highs change the background color to green and the new lows change the background color to red.
The column displays data for both new highs and new lows together. The count values allow you to sort by descending to show the stocks that have the largest number of new daily highs at the top. Flip that around to sort ascending and show the largest number of new daily lows at the top.
Set the time frame to any supported intraday time frame. The column will work with extended hours checked or unchecked. However if you check the extended hours option the counts will only include premarket data and not aftermarket data.
Here is your code:
def newDay = GetDay() <> GetDay()[1];

rec trackHigh = if newDay then high else if high > trackHigh[1] then high else trackHigh[1];

rec trackLow = if newDay then low else if low > 0 and low < trackLow[1] then low else trackLow[1]; def newHigh = high > trackHigh[1];

def newLow = low < trackLow[1]; rec countNewHighs = if newDay then 0 else if newHigh then countNewHighs[1] + 1 else countNewHighs[1]; rec countNewLows = if newDay then 0 else if newLow then countNewLows[1] - 1 else countNewLows[1]; plot data = if countNewHighs > AbsValue(countNewLows) then countNewHighs else countNewLows;

data.AssignValueColor(if newHigh or newLow then Color.BLACK else if data > 0 then Color.GREEN else if data < 0 then Color.RED else Color.CURRENT);

AssignBackgroundColor(if newHigh then Color.GREEN else if newLow then Color.RED else Color.CURRENT);