| ♥ 0 |
Opening Range Break Out code for the 5 minute chart. can any one help
Marked as spam
Asked on April 10, 2018 8:38 am
2775 views
|
|
Private answer
Not sure if you searched the forum before posting. Check this and see if does the job: https://www.hahn-tech.com/ans/scanning-for-premarket-highs-and-opening-range-breakouts/
Marked as spam
Answered on April 10, 2018 9:57 am
|
|||||
|
Private answer
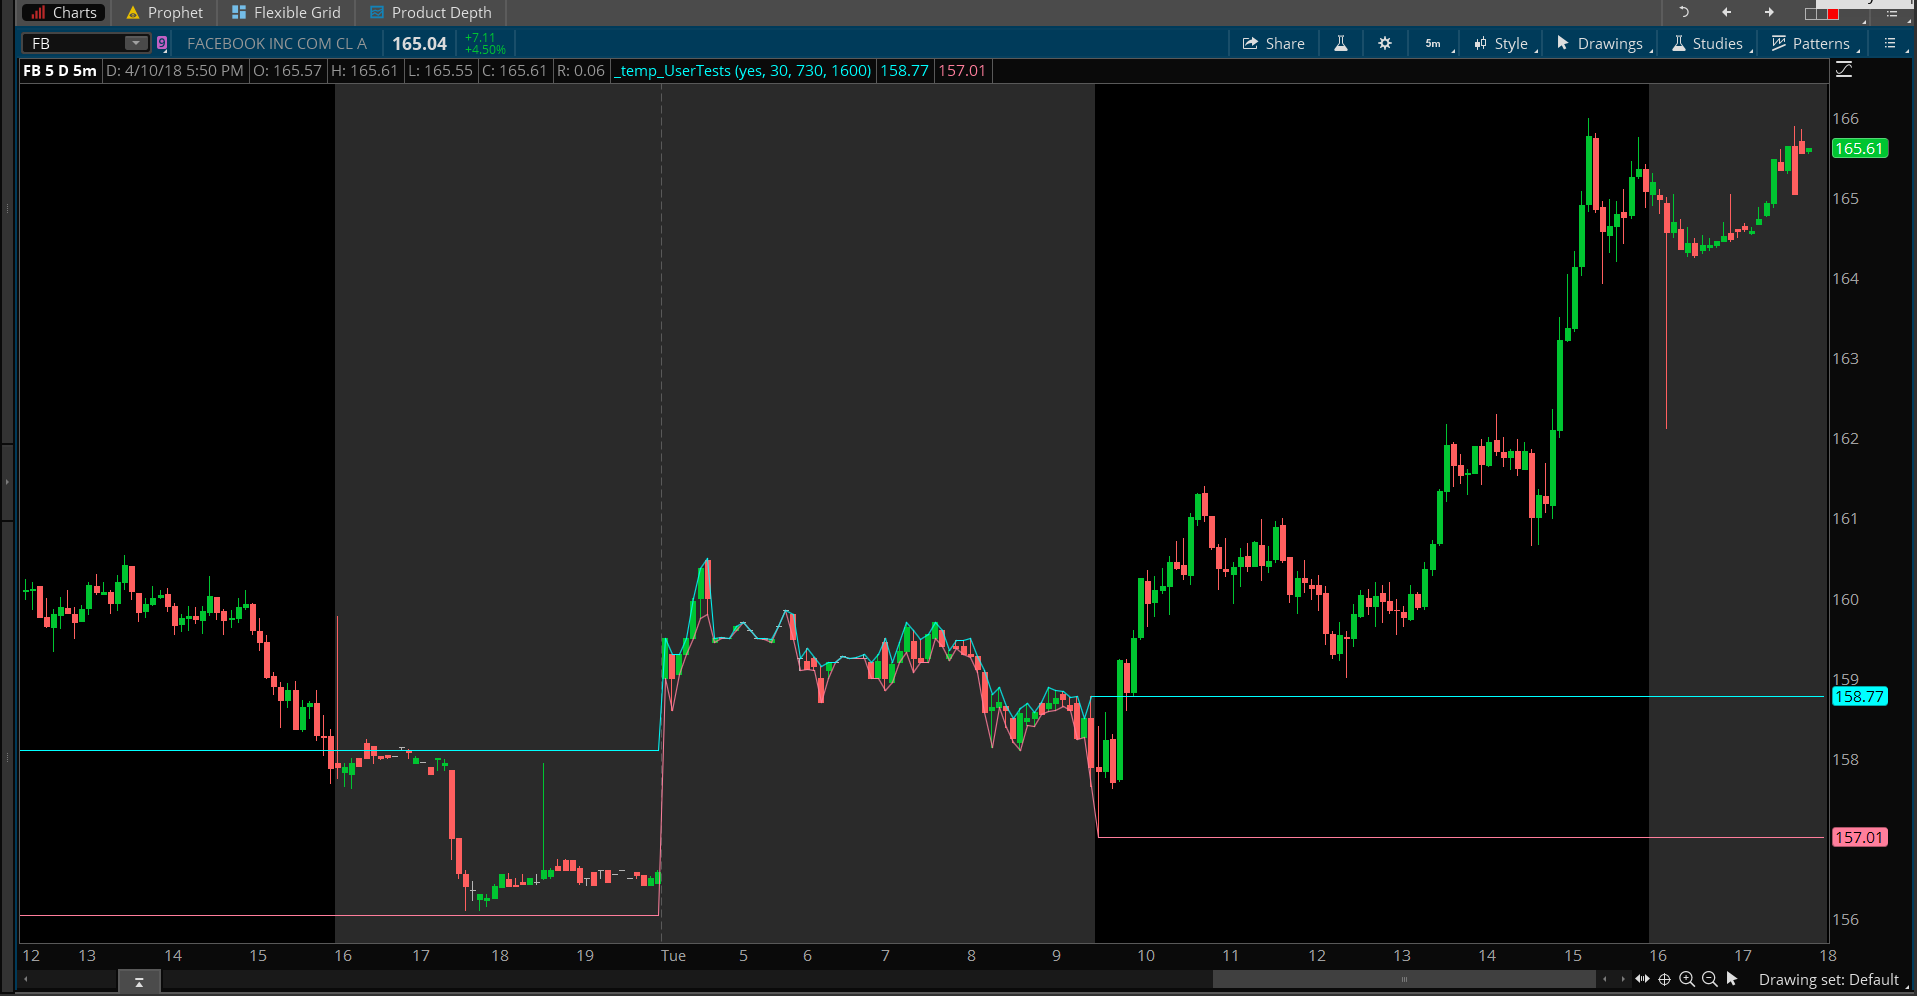
I see that Anthony is looking for both a stock scan as well as a chart study. Everything is provided via the link to the post I provided in my original answer: https://www.hahn-tech.com/ans/scanning-for-premarket-highs-and-opening-range-breakouts/ However it occurs to me not everyone is going to be able to read that post, locate the source code and make the adjustments needed to get things working. So here is the code, provided in the original post, modified to plot the Opening Range on the chart (screenshot shows the result).
If you want to use that code in a scan. Simply replace the last two lines with this one:
Attachments:
Marked as spam
Answered on April 10, 2018 4:18 pm
|
Anthony Tomassi, please do not use the “post your answer” box at the bottom of the thread unless you are providing a new solution to your question. If you only have a comment or clarification to add, do so using comment link below your original question, or one of the answers already posted.
Your answer is being deleted. The contents of your response is listed here:
“Thanks, I did see that it is for a gap up only. I would like a true opening rang breakout, up or down.”
Anthony. That code can easily be adjusted to account for the other side. The author of that post only asked for breakouts above opening range high. If you want, I can provide the line of code to add that will measure the other side:
plot scan = low < ORLow; You can combine them into a single statement like this: plot scan = high > ORHigh or low < ORLow;
Sorry, thanks for the input. “Thanks, I did see that it is for a gap up only. I would like a true opening rang breakout, up or down.”
Well you did post this in the “Stock Scanners” topic. So there was no implication that you actually wanted a chart study. Is it actually just a chart study that you wanted? Not a scan?
Thank you,
???
I think I wanted both, a scan to find the breakouts and also showing on the chart. However the scan is my first choice.
Thanks
Well the scan is what I gave you. Using the code provided in the post that I linked in my original answer. You simply add this line to create your scan signal:
plot scan = low < ORLow; You can combine them into a single statement like this: plot scan = high > ORHigh or low < ORLow;