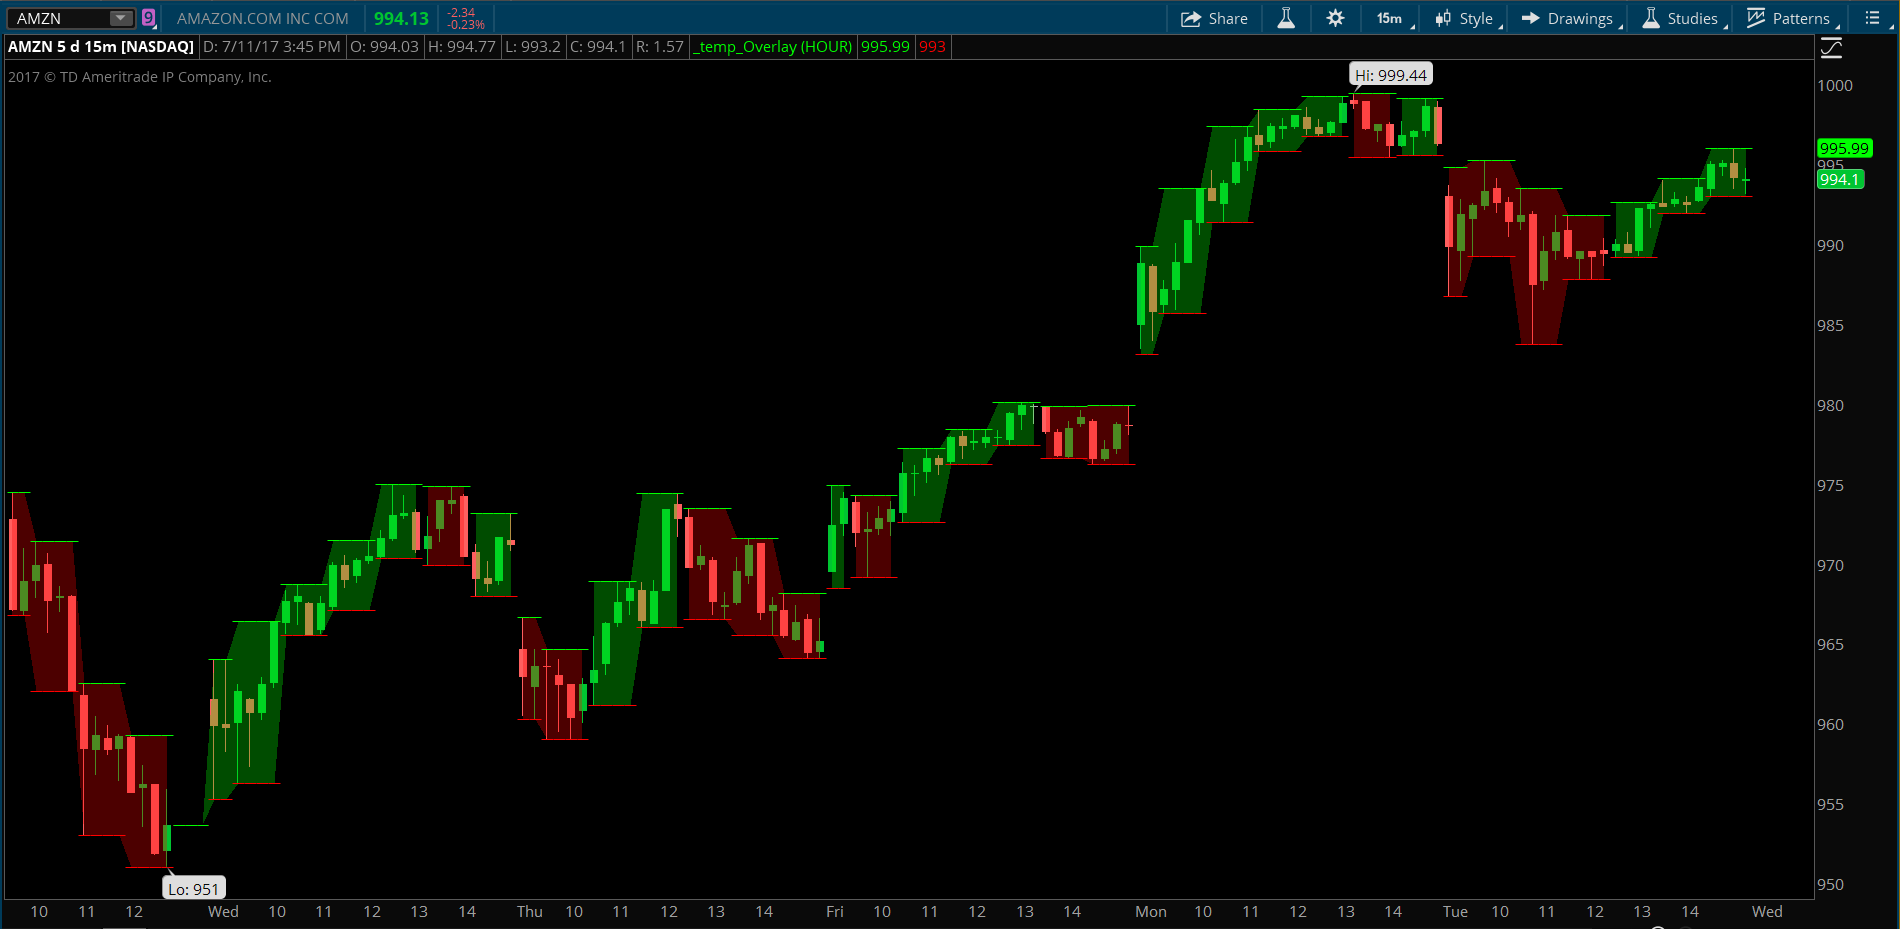
Here is code that plots an overlay of high and low from higher time frame. I’ve added a bit of bling by shading the space between the high and low based on whether the bar itself was an up bar or a down bar. Screenshot shows how it looks on the chart.
input higherTimeFrame = AggregationPeriod.HOUR;

def priceO = open(period = higherTimeFrame);

plot priceH = high(period = higherTimeFrame);

priceH.SetPaintingStrategy(PaintingStrategy.HORIZONTAL);

priceH.SetDefaultColor(Color.GREEN);

plot priceL = low(period = higherTimeFrame);

priceL.SetPaintingStrategy(PaintingStrategy.HORIZONTAL);

priceL.SetDefaultColor(Color.RED);

def priceC = close(period = higherTimeFrame);

def upBar = priceC >= priceO;

def downBar = priceC < priceO;

AddCloud(if upBar then priceH else Double.NaN, if upBar then priceL else Double.NaN, Color.GREEN, Color.DARK_GRAY);

AddCloud(if downBar then priceH else Double.NaN, if downBar then priceL else Double.NaN, Color.RED, Color.DARK_GRAY);