| ♥ 0 |
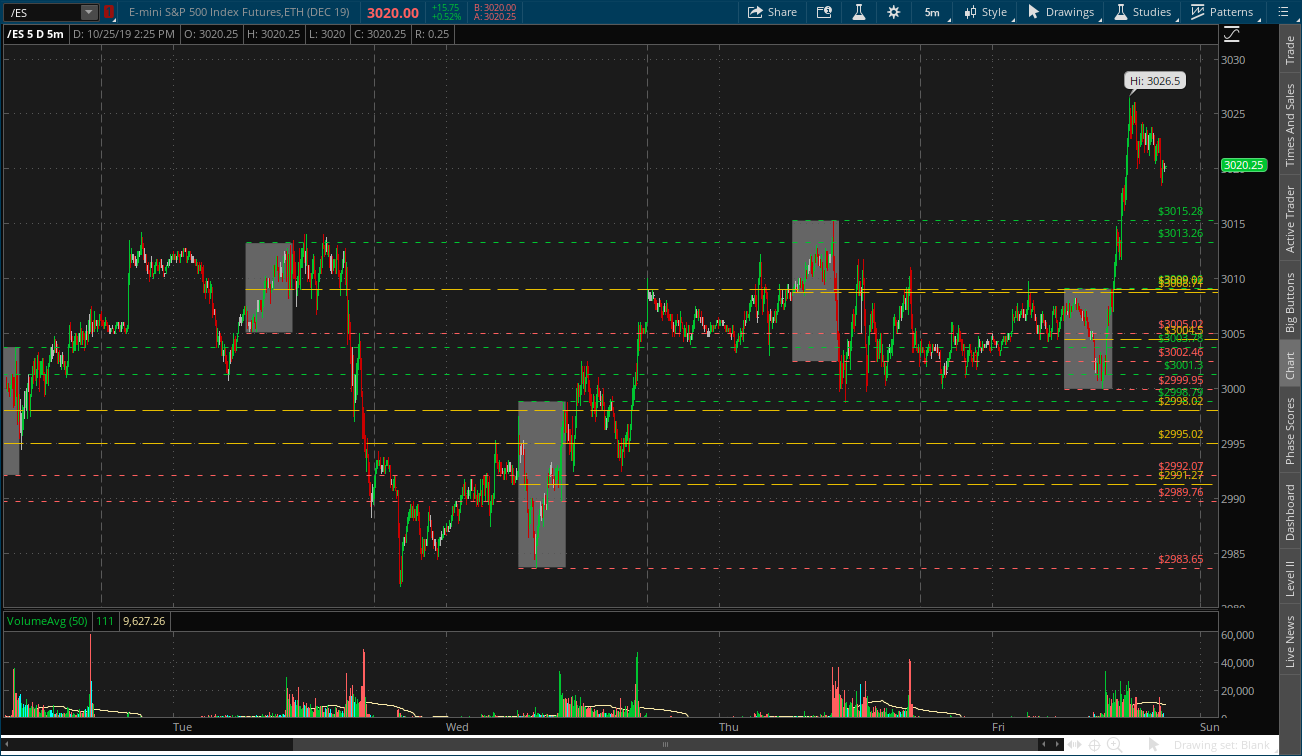
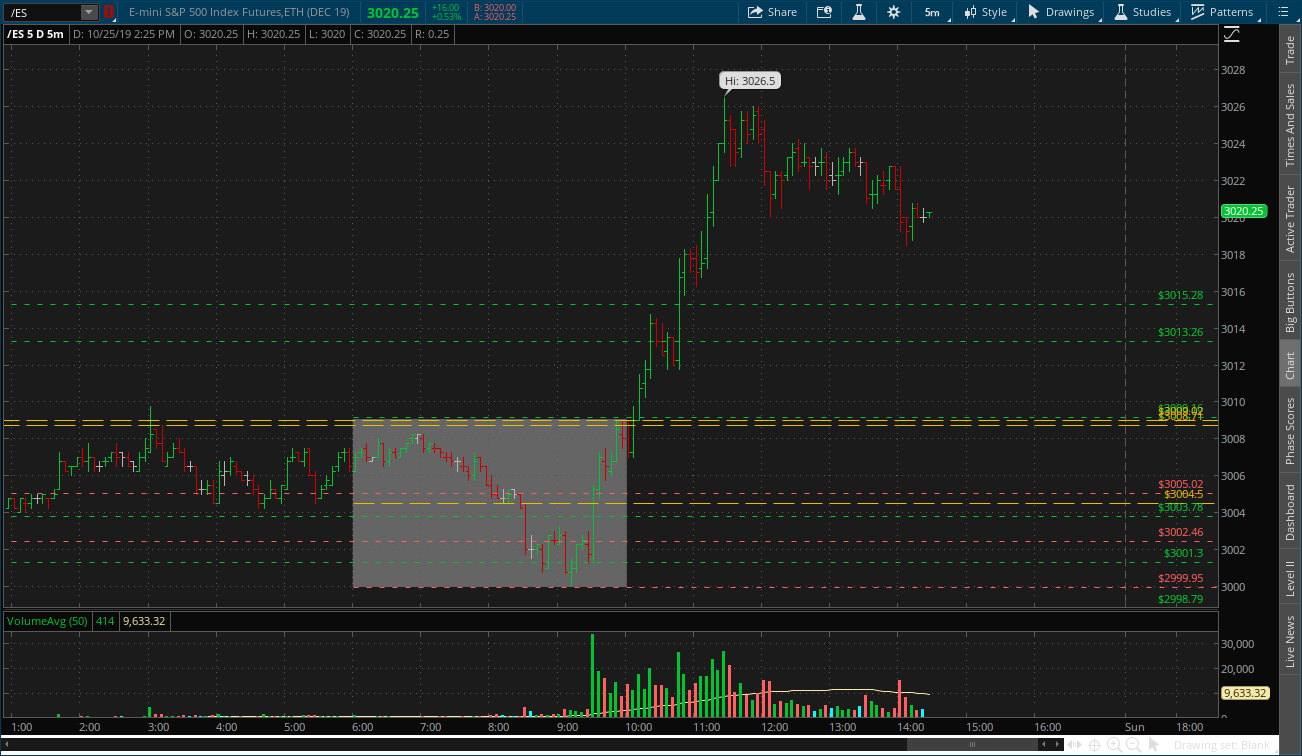
Hello, How could I have the 6:00am – 9:55 time frame pained with a box with the top of the box as the high in that range and the bottom the low of the time range. With that how can you add a dashed line to the right at the high, low and average of the 2? I will be using a 5 day 5 min chart with AH turned on. It would be great to have it plot on every day with high, low and averages of the 4 days back extending to the current trading day. I manually do this each day (Picture below) but it would be great to have it plot automatically. Any help would be greatly appreciated. I use the lines a support/ Resistance and profit targets. As you can see today 2 average lines and the high from the 6:00- 9:55 range converged and once price broke through we were off.
Attachments:
Marked as spam
Asked on October 25, 2019 11:44 am
147 views
|
|
Private answer
Ok, couple things before we get started. First is that the use of the phrase "time frame" already is associated with the aggregation period the chart is set to. What you really need to say is "time span" or "span of time". This ensures that folks will not be confused because almost everyone associates the phrase "time frame" with the aggregation period. So I will need to update the title of your question to account for that. Second is that we cannot draw boxes or lines on the chart using code in Thinkorswim. Those are called drawing objects and we can't create or modify them through the code of Thinkorswim. The best we can do is create shaded areas on the chart. Shaded areas that cover a specified span of time on the chart. However there are severe challenges involved in trying to replicate exactly what you have pictured in your chart. I have done something similar in a previous post: Only thing lacking there is the shading, which is supper easy to add. However you will notice this only works for the current day of trading and NOT for any periods prior to the current day. At the time I posted that solution I could not even imagine if there was a way to get it to plot on previous days on the chart. It may be possible. But it would require far too much time to figure out Much more time than what I permit for free assistance in the Q&A forum. As for your horizontal lines extending all the way to the right hand side of the chart. We can do this only for the current day but not for previous days. There is a possibility we can get there. But it would only work for a limited number of days. Each day you want included would need to be its own separate section of code. It's a ton of work and extremely complex to solve on Thinkorswim. Marked as spam
Answered on October 25, 2019 2:04 pm
|