| ♥ 0 |
Hi Pete: First of all, I’m sorry for my English, it’s very bad. I wanted to know if it is possible to make a scan that looks for the percentage variation (X) up or down, in (X) amount of time (days, weeks, months, years). Ex: Actions that have increased (or decreased) 50% or more in 6 months, 1 year or 2 years …
Marked as spam
Asked on August 21, 2019 12:26 pm
113 views
|
|
Private answer
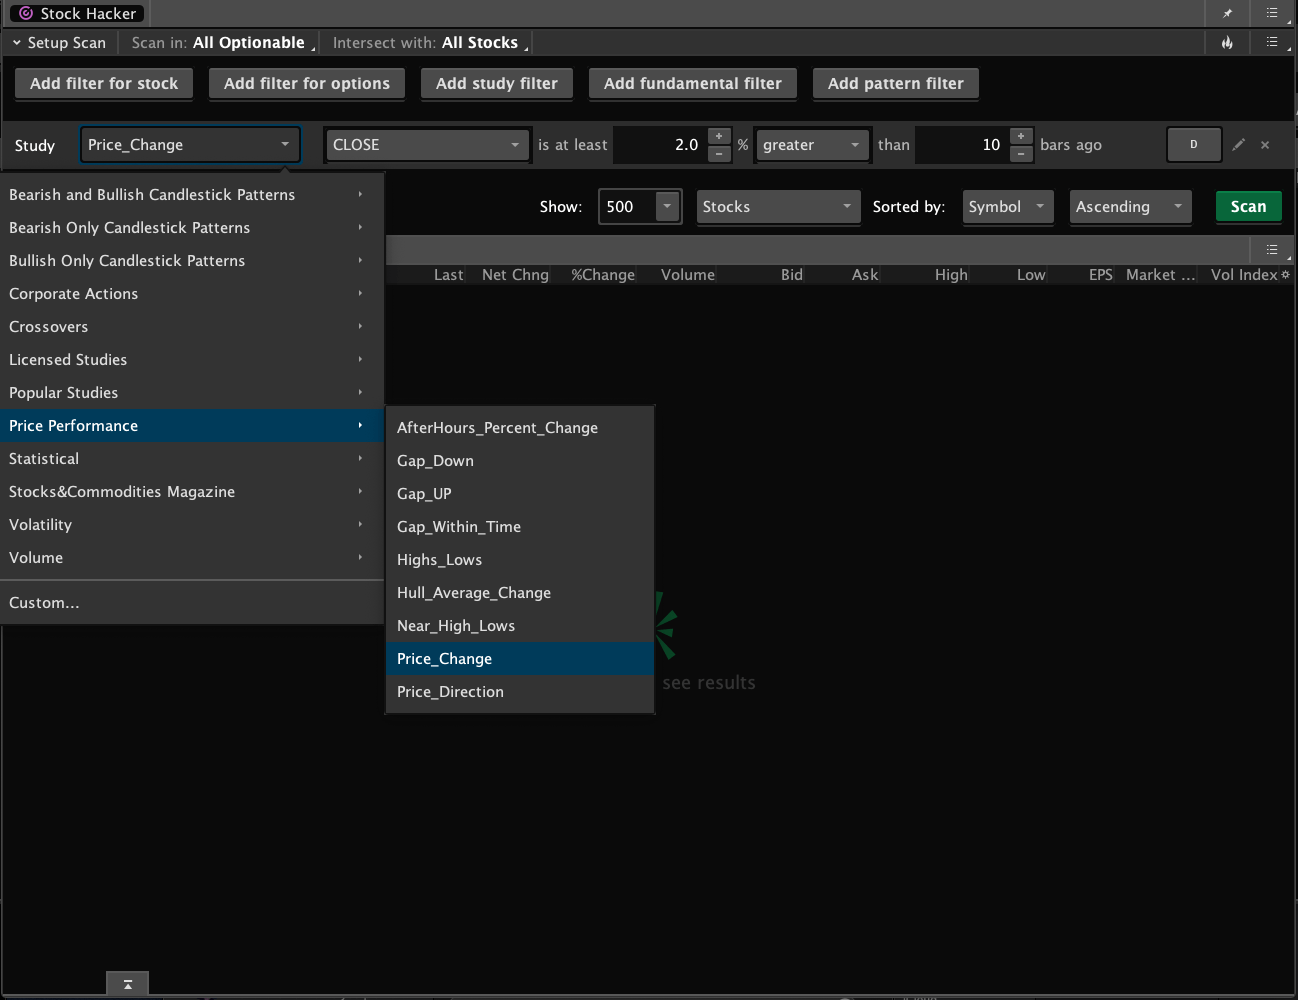
First, we need to be aware of how much historical data is available when running scans on Thinkorswim. Details here: http://toslc.thinkorswim.com/center/howToTos/thinkManual/Scan/Stock-Hacker/studyfilters.html So long as we stay within these limitations our scan will work. There is no code required to do this. The scan is already included in Thinkorswim as a built in Study filter. Screenshot below shows how to add it to your scan. You run these on a daily time frame. You can change the value of 252 to whatever value you want to search SO LONG AS IT FITS WITHIN THE HISTORICAL DATA LIMITS EXPLAINED IN THE LINK I PROVIDED ABOVE.
Attachments:
Marked as spam
Answered on August 21, 2019 1:02 pm
|