| ♥ 0 |
Hey Pete – I’d like an indicator that shows the 52 week high regardless of time frame chart I’m viewing. The premarket high-low study that you created (linked below) is in the same spirit of what I’m looking for, only with the 52-week highs/lows instead of premarket highs/lows. I tried using the “Daily High/Low” study on ToS, and changing the aggregation to Year, with a value of 1. That looked close, but the line didn’t stay on my charts when the time period was less than 1 year, I could only see it when I used a chart with a time period of 1yr or greater. Premarket high/low: https://www.hahn-tech.com/ans/plot-premarket-high-and-low-during-each-trading-session/ Thanks!
Marked as spam
|
|
Private answer
Sorry but this cannot be achieved. You must have data in order to compute a value. On Thinkorswim, if you do not have at least 52 weeks (1 year) of data viewable on the chart you cannot plot a 52 week high. The lowest time frame in which you can include 1 year of data on the chart is the 1 hour time frame. To be clear, that means you would set the chart to 1 hour time frame. Then adjust the "Time Interval" to 360 days. The "Time Interval" setting is found when you access the custom time frame settings on the chart. There are no ways to work around these limitations through any custom code on Thinkorswim. Marked as spam
Answered on November 5, 2020 8:27 am
|
|||||
|
Private answer
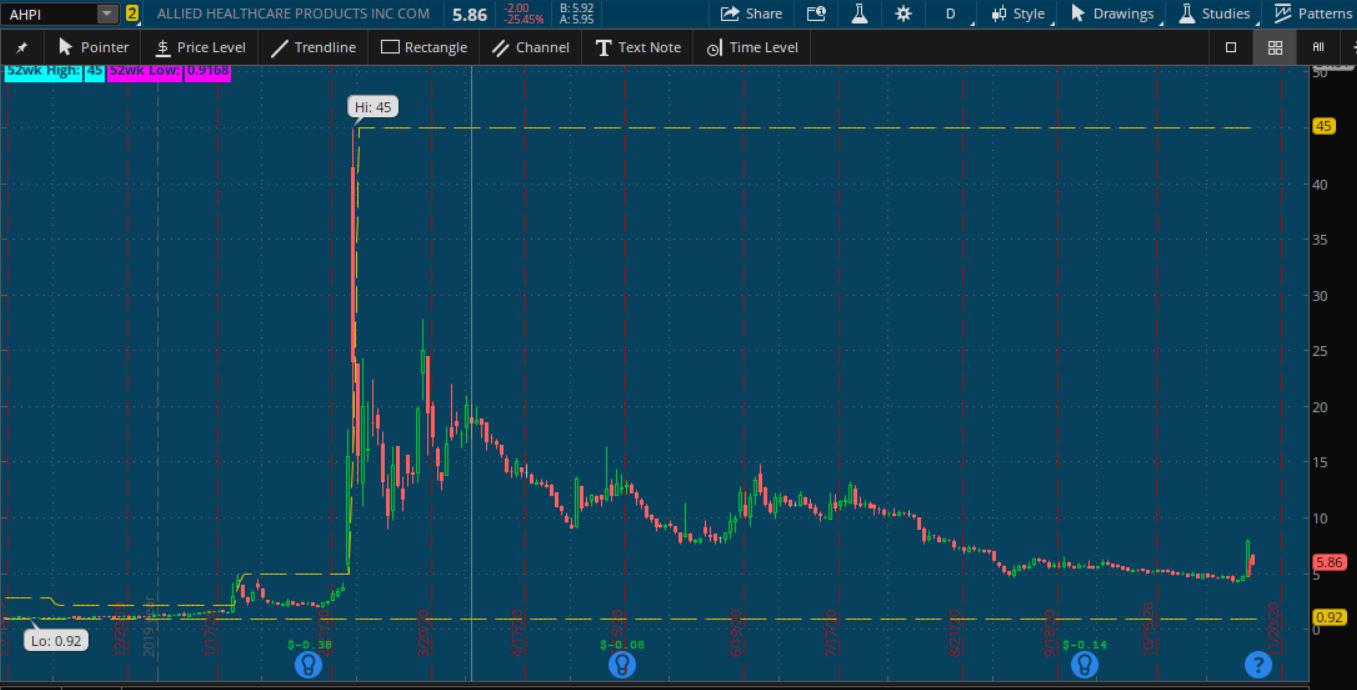
I found that this thread ( https://www.hahn-tech.com/ans/lowest-low-and-highest-high-between-2-dates/ ) combined with your answer above came close to what I'm looking for. I got what I want using the ToS's "Daily_High_Low", then setting it to Daily aggregation and a length of 253 (number of trading days in a year). I seem to have gotten a study I'm quite pleased with (code below). Interestingly enough, this actually does work on any time frame less than 1 year, the lines and labels stop showing up on any time frames greater than 1 year. That being said, I have a couple things that would make it better:
Anyway, here's my code: input aggregationPeriod = AggregationPeriod.DAY; plot DailyHigh; DailyHigh.SetDefaultColor(GetColor(4)); AddLabel(yes, "52wk High:", color.CYAN); Attachments:
Marked as spam
Answered on November 15, 2020 2:32 pm
|