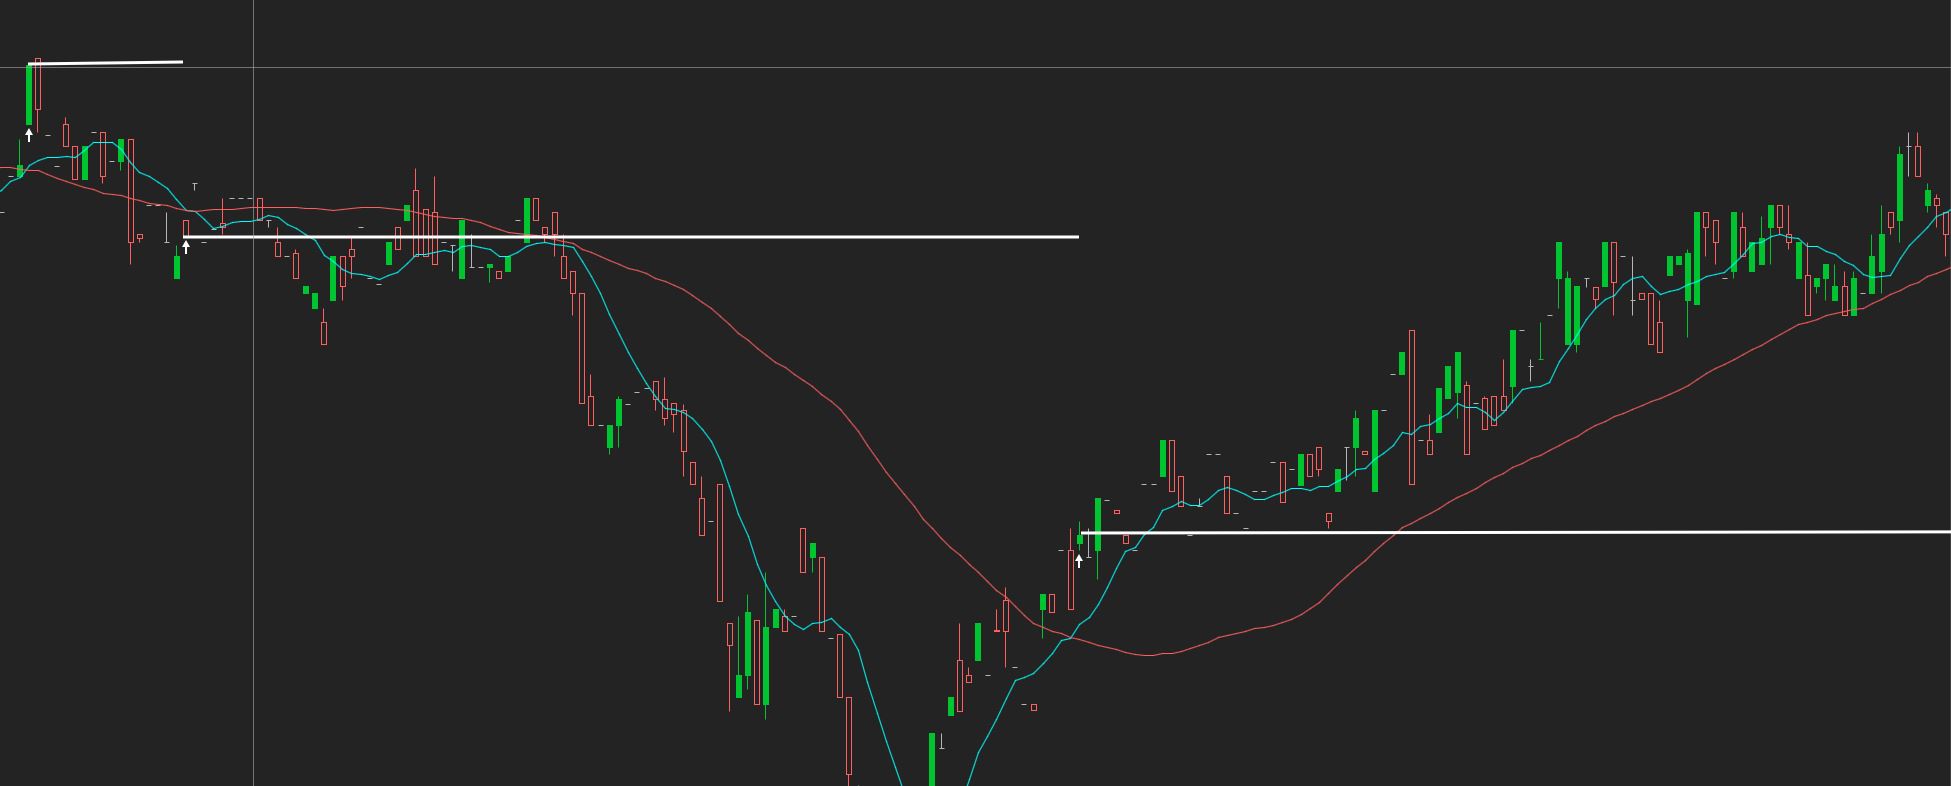
Plot horizontal line extension at cross


Category:
0
0

Hi Pete,
Thank you for the great resources. I have a simple script below where I am trying to plot a horizontal line that extends to the right at every cross over signal.

def avg1 = MovingAverage(AverageType.SIMPLE, close, 10);
def avg2 = MovingAverage(AverageType.SIMPLE, close, 50);

plot cross = avg1 crosses avg2;
cross.SetPaintingStrategy(PaintingStrategy.BOOLEAN_ARROW_UP);
cross.SetDefaultColor(Color.WHITE);
cross.SetLineWeight(1);

I want the start of the line to begin at the signal and end when a new signal appears. I have attached a screenshot (plotted the white lines manually) to illustrate what I mean.

Thank you for your help.

Attachments:
RESOLVED
Marked as spam
Posted by (Questions: 3, Answers: 3)
Asked on January 8, 2021 5:21 pm
93 views
0
Thank you, works perfectly. WIll donate to support!
( at January 9, 2021 10:25 am)
0
Thanks for your voluntary contribution. We do not use the term "donate" anywhere on this site because Hahn-Tech, LLC is a for profit business. In addition to this I need to make sure the rest of our viewers understand that solutions in this forum are NOT supported by "voluntary contributions". We do provide professional services but the solutions I provide on this Q&A Forum are 100% free and "voluntary contributions" are NOT solicited nor are they even encouraged for free solutions I provide in this forum. But they are very happily received. Thank you.
( at January 9, 2021 10:30 am)
0
Private answer

Add the following lines of code to the bottom of the code you provided in your example:

rec trackPrice = if cross then close else trackPrice[1];
plot crossoverPrice = trackPrice;
crossoverPrice.SetPaintingStrategy(PaintingStrategy.HORIZONTAL);

Marked as spam
Posted by (Questions: 37, Answers: 4087)
Answered on January 9, 2021 10:19 am