I had to update the title of your question because the one you entered did not include one of the most important details. Titles are important to our viewers so that they can find the solutions they are seeking without having to read through every single post.
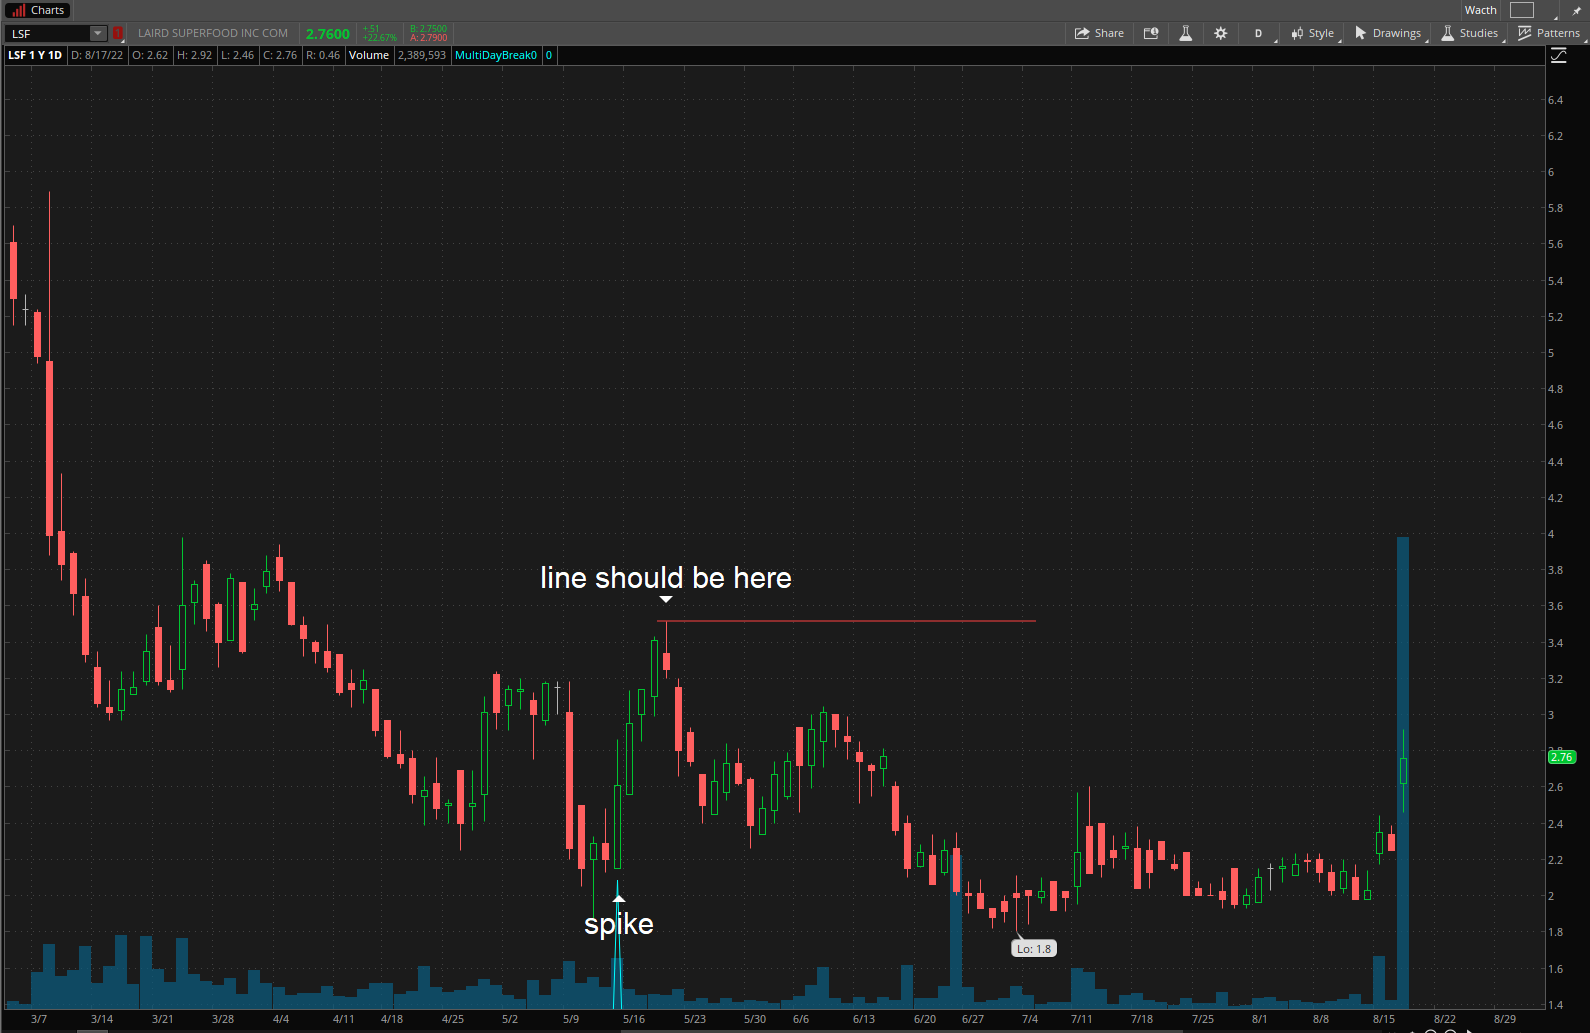
It is not possible to add drawing objects to a chart from a custom chart study on Thinkorswim. We can only work with plot statements. So we cannot draw a single line that tracks the higher highs exactly the way you indicated on your example screenshot. However we can present something similar using a plot statement.
In order to terminate the line after a specified number of bars we need to add a user input named "extensionBars". Another user input has been added to allow users to adjust the percent threshold used to detect these price spikes.
Here is the code that performs as you have requested:
input percentThreshold = 30.0;

input extensionBars = 10;

def spike = 100 * (high / close[1] -1) > percentThreshold;

rec countSinceSpike = if spike then 1 else if countSinceSpike[1] < extensionBars then spike[1] + 1 else Double.NaN; rec trackHigh = if spike then high else if high > trackHigh[1] and high > high[1] then high else if Highest(spike, extensionBars) == 0 then Double.NaN else trackHigh[1];

plot line = trackHigh;