Plot % Lines around Entry


Category:
0
0

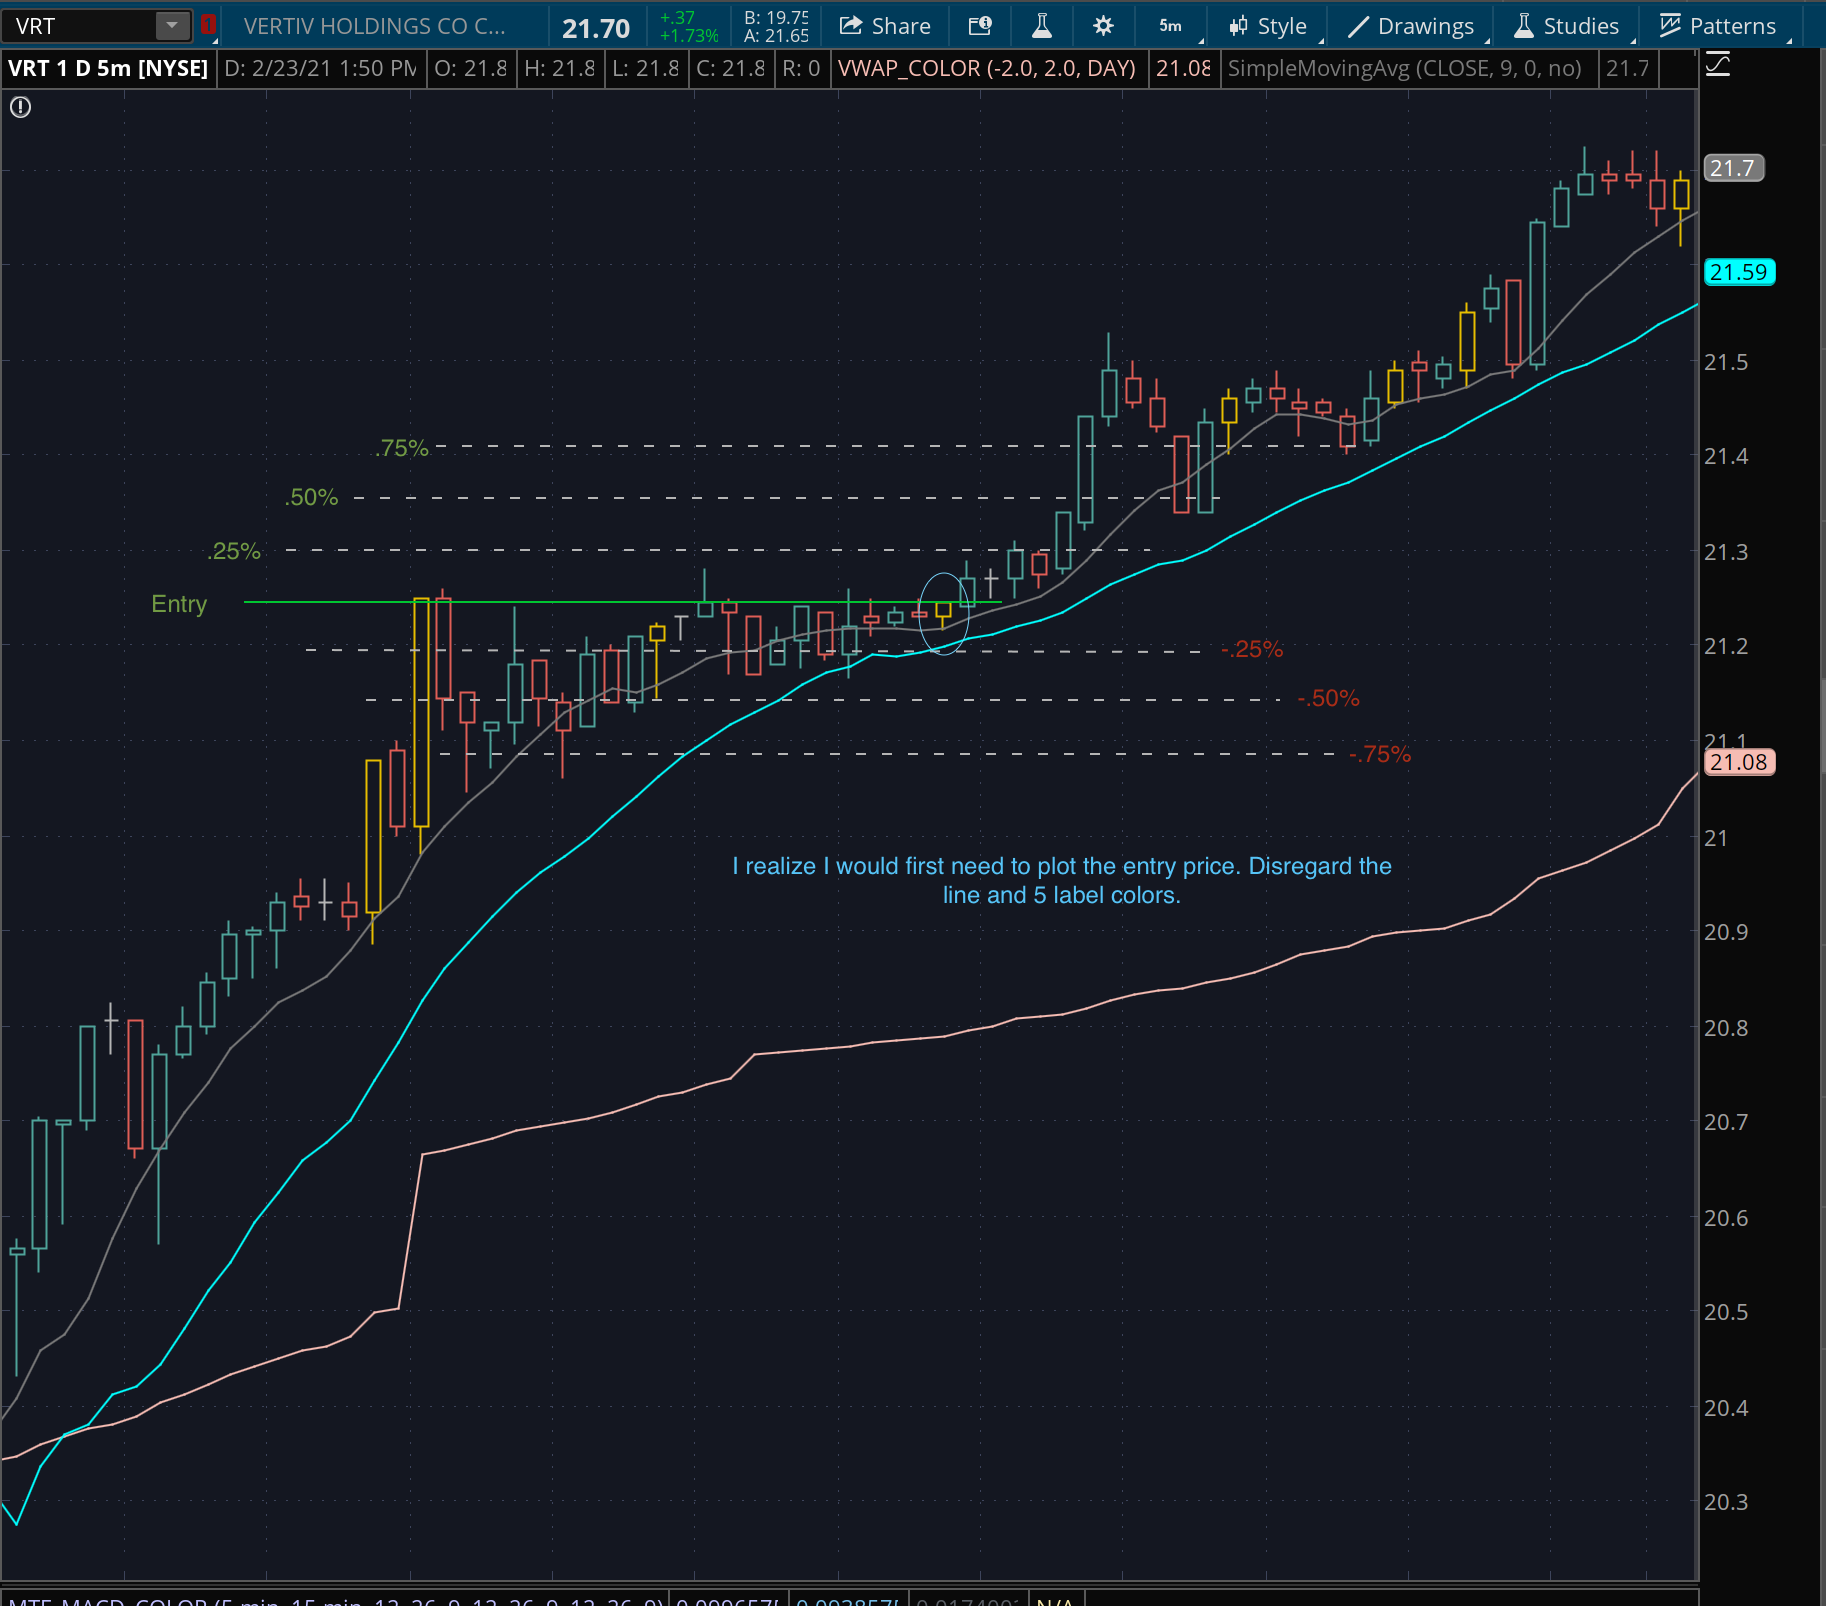
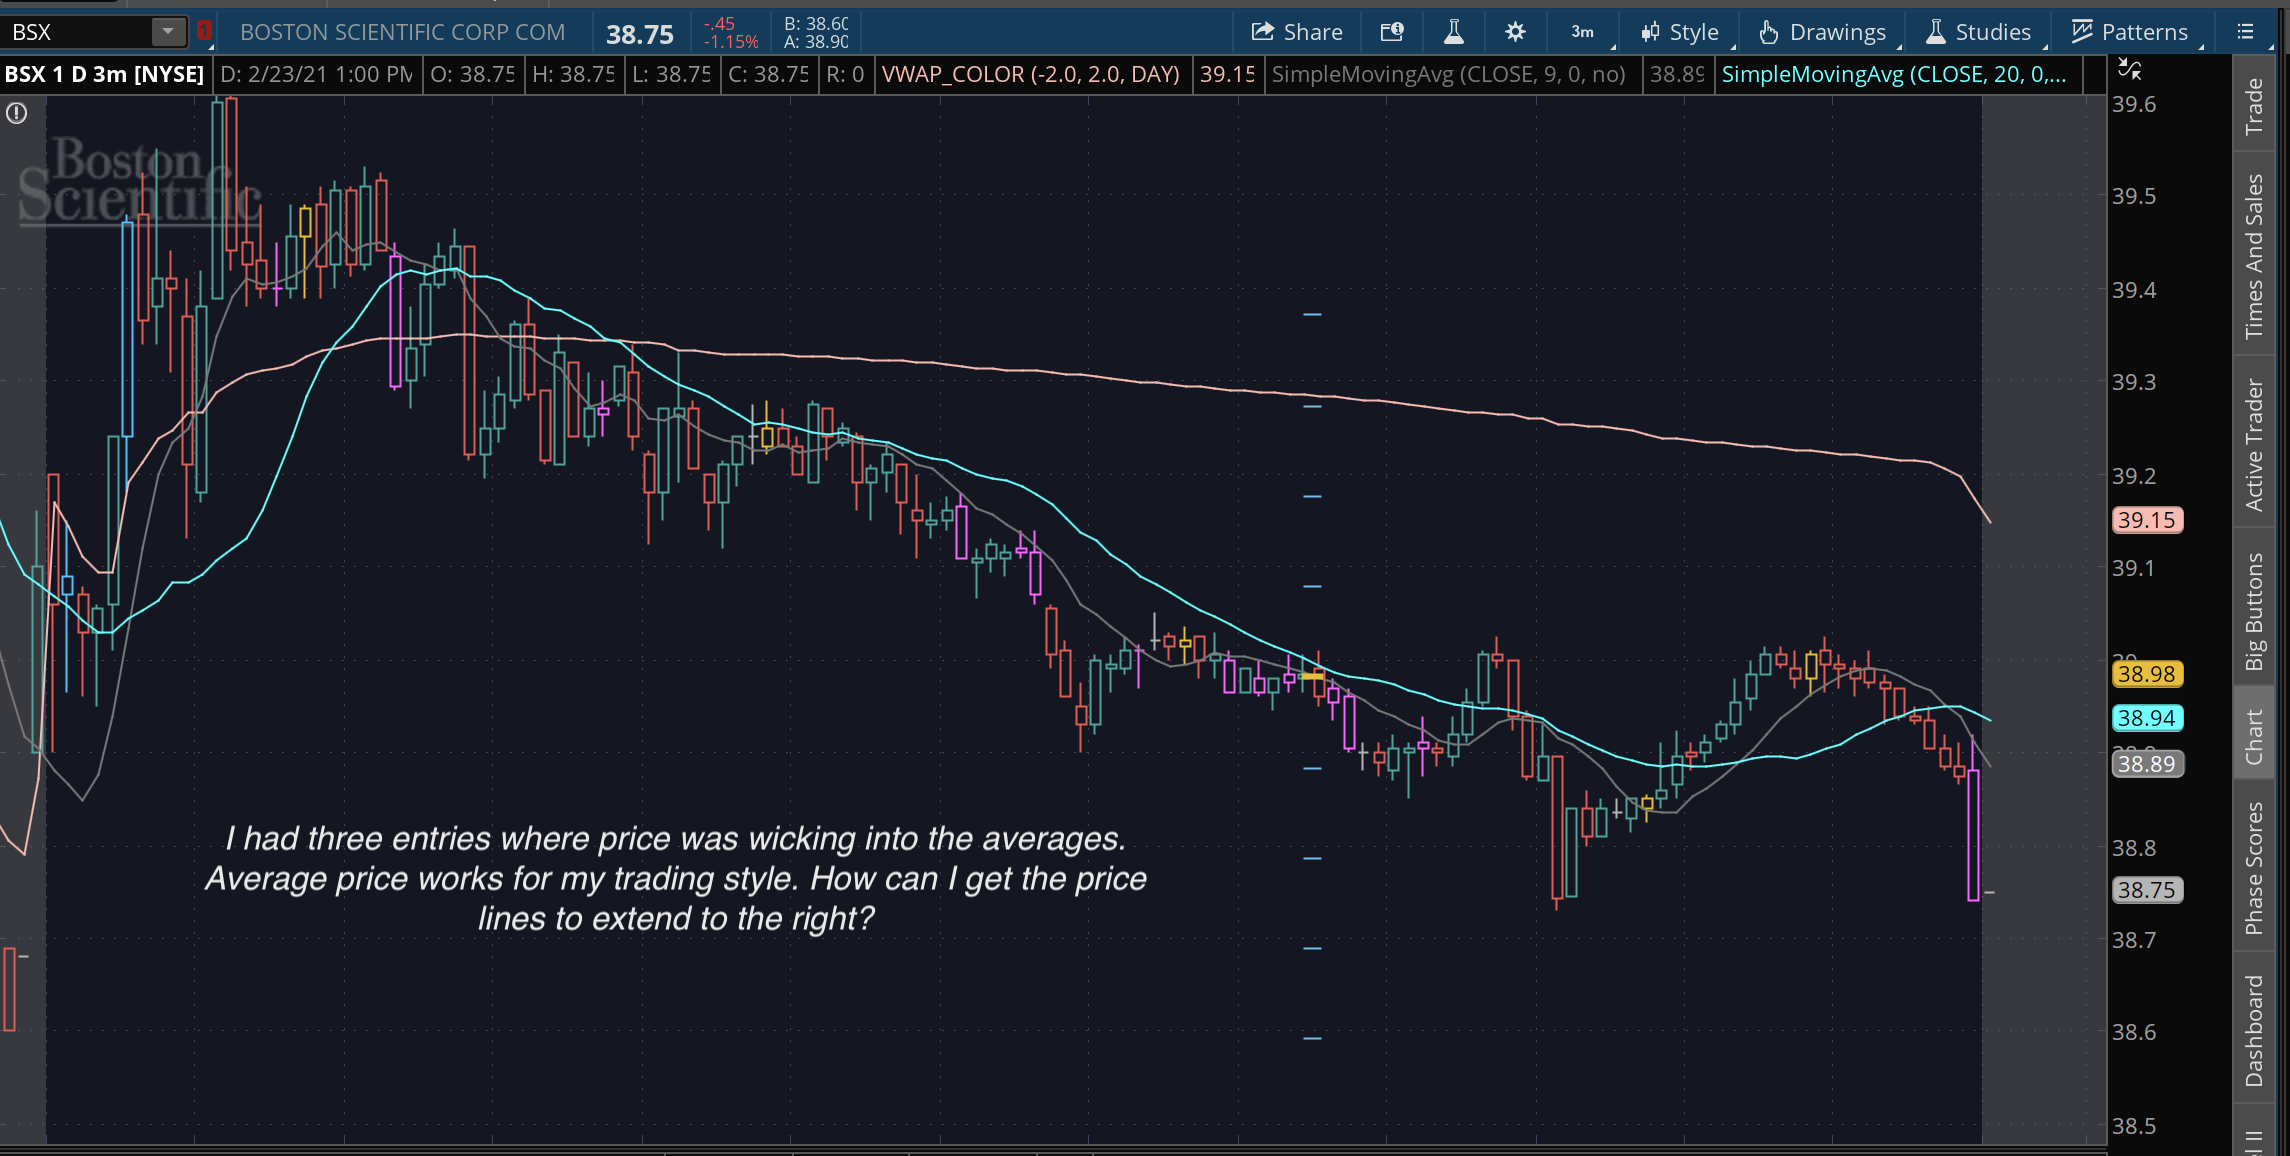
Hello again. I was wondering if there is way to plot % lines around an order entry. When I trade I like to aim for 1% , and like to be aware of .25 .50 and .75 % profs levels and where they are in regard to price action.  I’m aware of the ‘Show Trades” option. Im not sure as of now if I should pursue a chart study or if a drawing tool is more effective and easy to use?    For now I’m glued to using the Line Tool’s data box to manually keep track of and draw % lines from my entry price. I drew lines on the picture below of what I’m trying to achieve.  Any advice always appreciated. Hoping you can point me in right direction.

Attachments:
Marked as spam
Posted by (Questions: 11, Answers: 15)
Asked on February 23, 2021 8:04 pm
166 views
0
Sorry to bug again but just noticed that the code I included in my answer post won't show any of the line plots on other charts I traded today. the bubble plots are present on the price axis but no lines on the chart..
( at February 23, 2021 10:32 pm)
0
You will be much better off using drawing tools and handling this manually. There is no way to achieve exactly what you are describing on Thinkorswim because we can only work with plot statements. We cannot create and modify drawing objects.
( at February 24, 2021 8:56 am)
0
Private answer

Ok here's my attempt

def averagePrice=GetAveragePrice();
plot AverageTradePrice=if(averagePrice > 0, averagePrice, double.NaN);

plot a = AverageTradePrice + (averageTradeprice * .0025) ;
plot b = AverageTradePrice + (averageTradeprice * .0050) ;
plot c = AverageTradePrice + (averageTradeprice * .0075) ;
plot d = AverageTradePrice + (averageTradeprice * .01) ;

plot e = AverageTradePrice - (averageTradeprice * .0025) ;
plot f = AverageTradePrice - (averageTradeprice * .0050) ;
plot g = AverageTradePrice - (averageTradeprice * .0075) ;
plot h = AverageTradePrice - (averageTradeprice * .01) ;
#

I realized average trade price would be best instead of having lines around all of my often clustered entries.
What Im trying to figure now is how to have the plotted lines extend to the right a ways ( infinite is fine ). Hope Im on the right track!

Attachments:
Marked as spam
Posted by (Questions: 11, Answers: 15)
Answered on February 23, 2021 9:53 pm