Plot lines for prior day high and low across specified time span


Category:
0
0

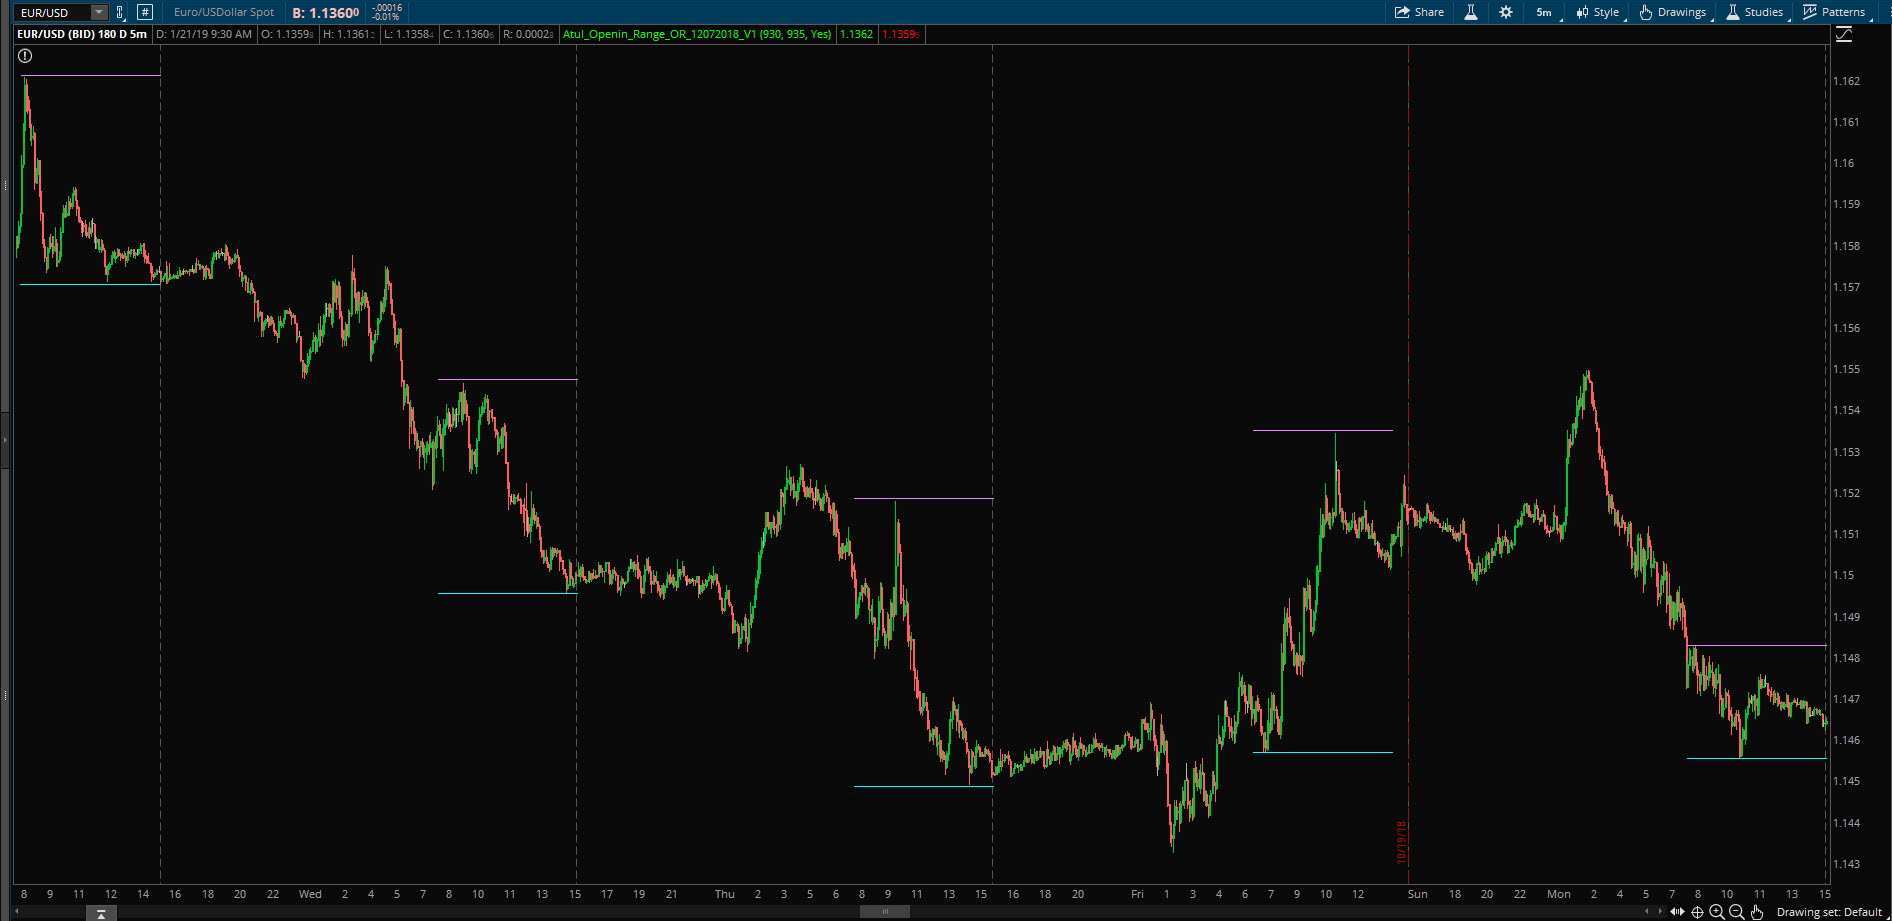
Hi Pete,

I am trying to create a study to add horizontal lines across previos day high low only across US session. I want to specify the start time, end time as 0800 and 1600 hours.  I tried to modify your earlier code, but it does not work.

##############################

input startTime = 800;
input endTime = 1600;
def timeUntilClose = SecondsTillTime(endTime);
def timeUntilOpen = SecondsTillTime(startTime);
def targetPeriod = timeUntilClose > 0;
def targetPeriodHigh = if targetPeriod and !targetPeriod[1] then high else if targetPeriod and high > targetPeriodHigh[1] then high else targetPeriodHigh[1];
def targetPeriodLow = if targetPeriod and !targetPeriod[1] then low else if targetPeriod and low < targetPeriodLow[1] and low > 0 then low else targetPeriodLow[1];
#AddLabel(yes, Concat(“Period High: “, targetPeriodHigh), Color.GREEN);
#AddLabel(yes, Concat(“Period Low: “, targetPeriodLow), Color.RED);
plot targetPeriodHigh1 = if targetPeriod and !targetPeriod[1] then high else if targetPeriod and high > targetPeriodHigh[1] then high else targetPeriodHigh[1];
plot targetPeriodLow1 = if targetPeriod and !targetPeriod[1] then low else if targetPeriod and low < targetPeriodLow[1] and low > 0 then low else targetPeriodLow[1];

##################

Please look at the screen shot to see how I want it to look. I request you to please help.

Attachments:
Marked as spam
Posted by (Questions: 3, Answers: 4)
Asked on January 21, 2019 8:46 am
194 views
0

Please provide a link to where the “previous code” was posted. This will help inform everyone as to the context and intent of that code.

And we are going to update this title: “Horizontal Line across previous day high low for US session Forex maket”. The new title to the question will have a broader scope to fit the context of your request.

The new title will be: “Plot lines for prior day high and low across specified time span”

( at January 21, 2019 9:26 am)
0

Hi Pete, Thank you for your comment. I used the code from the earlier post titled “Premarket High/Low label” asked on Jan 10, 2019.
The new title for my question looks great.

( at January 22, 2019 11:41 am)
0

Hi Pete, If you were waiting on me for posting the link, I could not do it as I was not able to copy the link to that specific post. When I try to grab the link, it takes me to the ThinkOrSwim Chart Studies Q&A page. like this “https://www.hahn-tech.com/thinkorswim-chart-studies/”. Therefore I have given the reference of the title and the date of the post. Thank you.

( at January 23, 2019 12:29 pm)
0
Private answer

Actually the code you used to start your project was completely inadequate to get the job done. I went straight to our video titled: Thinkorswim Overnight Range Scan Alert. The code provided with that study has an “alert period”, which can be adjusted through the user inputs. The rest of the code is not needed, but those lines that form the alert period are exactly what was needed for this solution.

So here is the code to plot previous day’s high and low on an intraday chart, while limiting those plots to a specified period of time.

input marketOpen = 800;
input marketClose = 1600;
def startCounter = SecondsFromTime(marketOpen);
def endCounter = SecondsTillTime(marketClose);
def targetHours = if startCounter >= 0 and endCounter >= 0 then 1 else 0;
def previousDayHigh = high(period = AggregationPeriod.DAY)[1];
def previousDayLow = low(period = AggregationPeriod.DAY)[1];
plot priorDayHigh = if targetHours then previousDayHigh else Double.NaN;
plot priorDayLow = if targetHours then previousDayLow else Double.NaN;

Update: After getting feedback on this code it was brought to my attention I did not follow the requested specification. The actual goal was to capture the high and low of the specified period from the previous day and plot those levels on the current intraday chart. The following code meets this goal.

input marketOpen = 800;
input marketClose = 1600;
def startCounter = SecondsFromTime(marketOpen);
def endCounter = SecondsTillTime(marketClose);
def targetHours = if startCounter >= 0 and endCounter >= 0 then 1 else 0;
rec targetPeriodHigh = if targetHours and !targetHours[1] then high else if targetHours and high > targetPeriodHigh[1] then high else if targetHours then targetPeriodHigh[1] else Double.NaN;
rec targetPeriodLow = if targethours and !targetHours[1] and low > 0 then low else if targetHours and low < targetPeriodLow[1] then low else if targetHours then targetPeriodLow[1] else Double.NaN;
rec previousDayHigh = if targetHours[1] and !targetHours then targetPeriodHigh[1] else previousDayHigh[1];
rec previousDayLow = if targetHours[1] and !targetHours then targetPeriodLow[1] else previousDayLow[1];
plot priorDayHigh = previousDayHigh;
priorDayHigh.SetDefaultColor(Color.GREEN);
plot priorDayLow = previousDayLow;
priorDayLow.SetDefaultColor(Color.RED);

Marked as spam
Posted by (Questions: 37, Answers: 4087)
Answered on January 29, 2019 1:37 pm
0

Hi Pete,

This code plots the high and low of the entire previous day across the specified time. May be I did not explain corectly. I want the high and low of the specified time from the previous day to be plotted on the specified time from today. If I could specifically input a particular date and particular time, that would be ideal.
For example, if I want to plot the high and low from 8.00 am to 4.00 pm as of 01/29/2019 on today’s session from 8.00 am to 4.00 pm, that would be very helpful. I request for your help on this. Thanks a lot!

( at February 4, 2019 8:37 am)
0

Ok, I think I’ve got it now. I have updated my answer to include the new updated code. This does not include the ability to specify the date. This only looks at previous day.

( at February 6, 2019 9:18 am)