Plot opening range high and low


Tags:
Category:
0
0

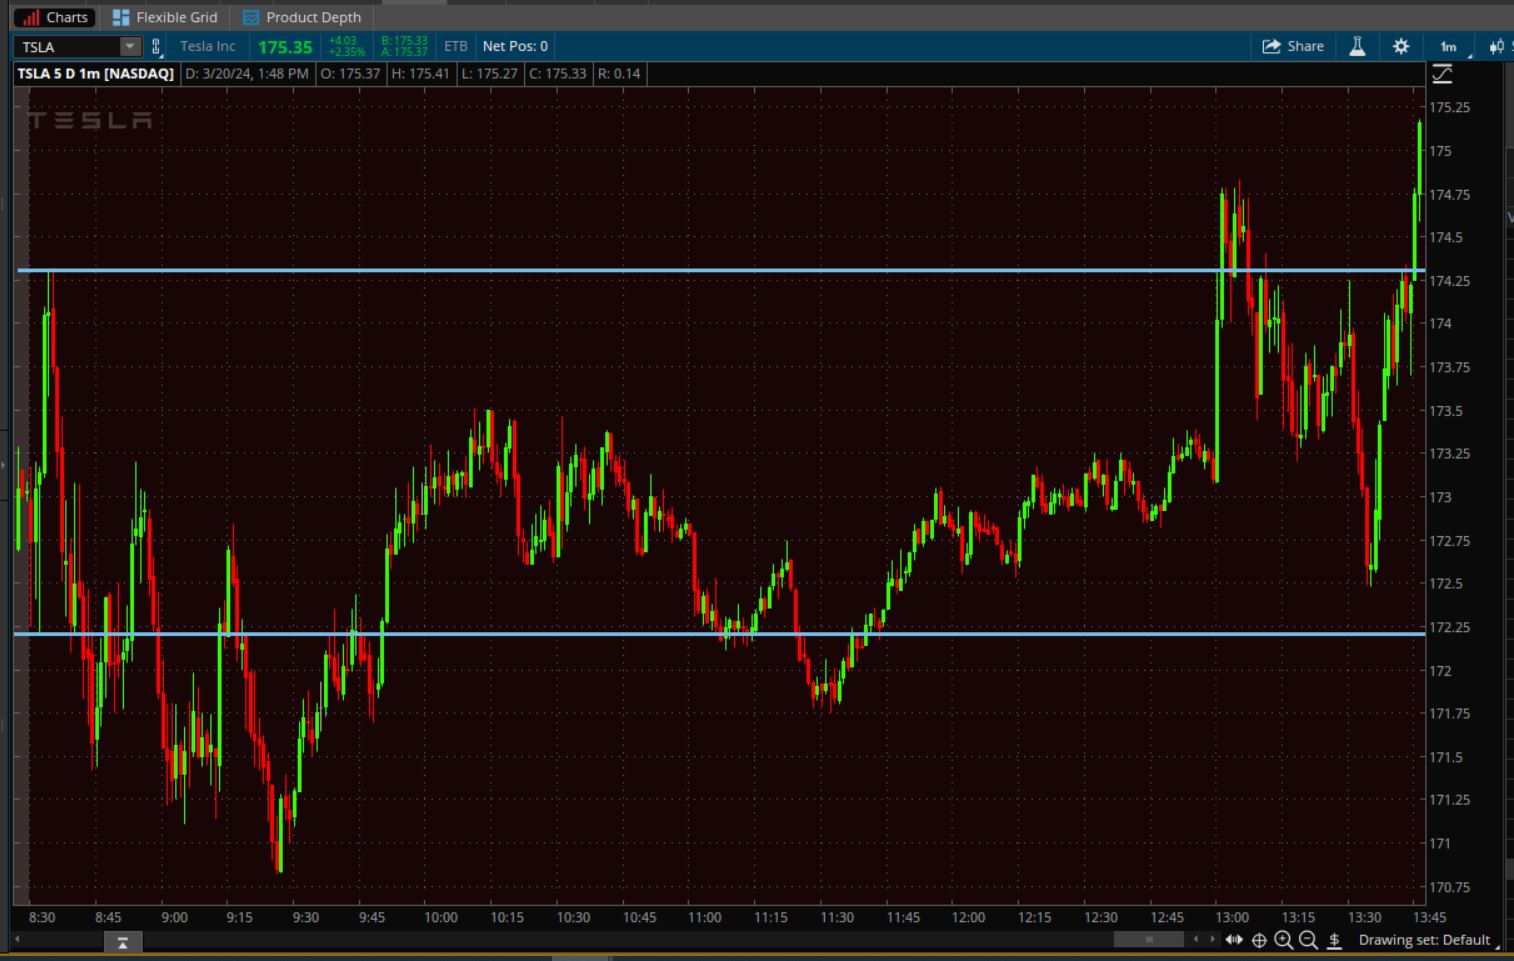
Hello Pete,

Will you create a study that does the following?

  • Plots lines for the high and low of the first 5 minutes of the open
  • Extends the high and low plot lines from market open to market close of the current day

It would look something like the attached pic.


I did find a similar q&a but it was for the previous day instead of the first 5 minutes:

https://www.hahn-tech.com/ans/plot-previous-day-high-and-low-on-intraday-chart/

Thank you for your time.

Attachments:
Marked as spam
Posted by (Questions: 1, Answers: 1)
Asked on March 20, 2024 3:42 pm
30 views
0
Private answer

Since you are requesting a chart study I moved your question out of the "Frequently Asked Questions" topic and into the "Chart Studies" topic. I also updated the title of your question so that it more clearly describes the solution you have requested. This will make it easier for other viewers to locate this solution using the search function.

I see we have already published solutions for opening range breakouts but those were requested for custom scans and not the actual chart study.

The following solution plots the lines as you described and also includes user inputs to adjust the start and end time of the opening range:

input openingRangeStartTime = 930;
input openingRagneEndTime = 935;
def openingRangeSpan = SecondsFromTime(openingRangeStartTime) >= 0 and SecondsTillTime(openingRagneEndTime) > 0;
def openingRangeBegin = !openingRangeSpan[1] and openingRangeSpan;
def openingRangeHigh = if openingRangeBegin then high else if openingRangeSpan and high > openingRangeHigh[1] then high else openingRangeHigh[1];
def openingRangeLow = if openingRangeBegin then low else if openingRangeSpan and low > 0 and low < openingRangeLow[1] then low else openingRangeLow[1];
plot orHigh = openingRangeHigh;
orHigh.SetDefaultColor(Color.DARK_GREEN);
orHigh.SetPaintingStrategy(PaintingStrategy.HORIZONTAL);
plot orLow = openingRangeLow;
orLow.SetDefaultColor(Color.DARK_RED);
orLow.SetPaintingStrategy(PaintingStrategy.HORIZONTAL);

Marked as spam
Posted by (Questions: 37, Answers: 4087)
Answered on March 20, 2024 3:46 pm
0
Thank you Pete. It works great. For a cleaner look on the charts, is it possible to edit the code so that the lines only extend from 9:30am to 4pm instead of extending across all 24 hours? Thanks again.
( at March 21, 2024 3:50 pm)
0
That is certainly possible but that is bit beyond the level of complexity I can provide free of charge in the Q&A Forum.
( at March 21, 2024 4:59 pm)