| ♥ 0 |
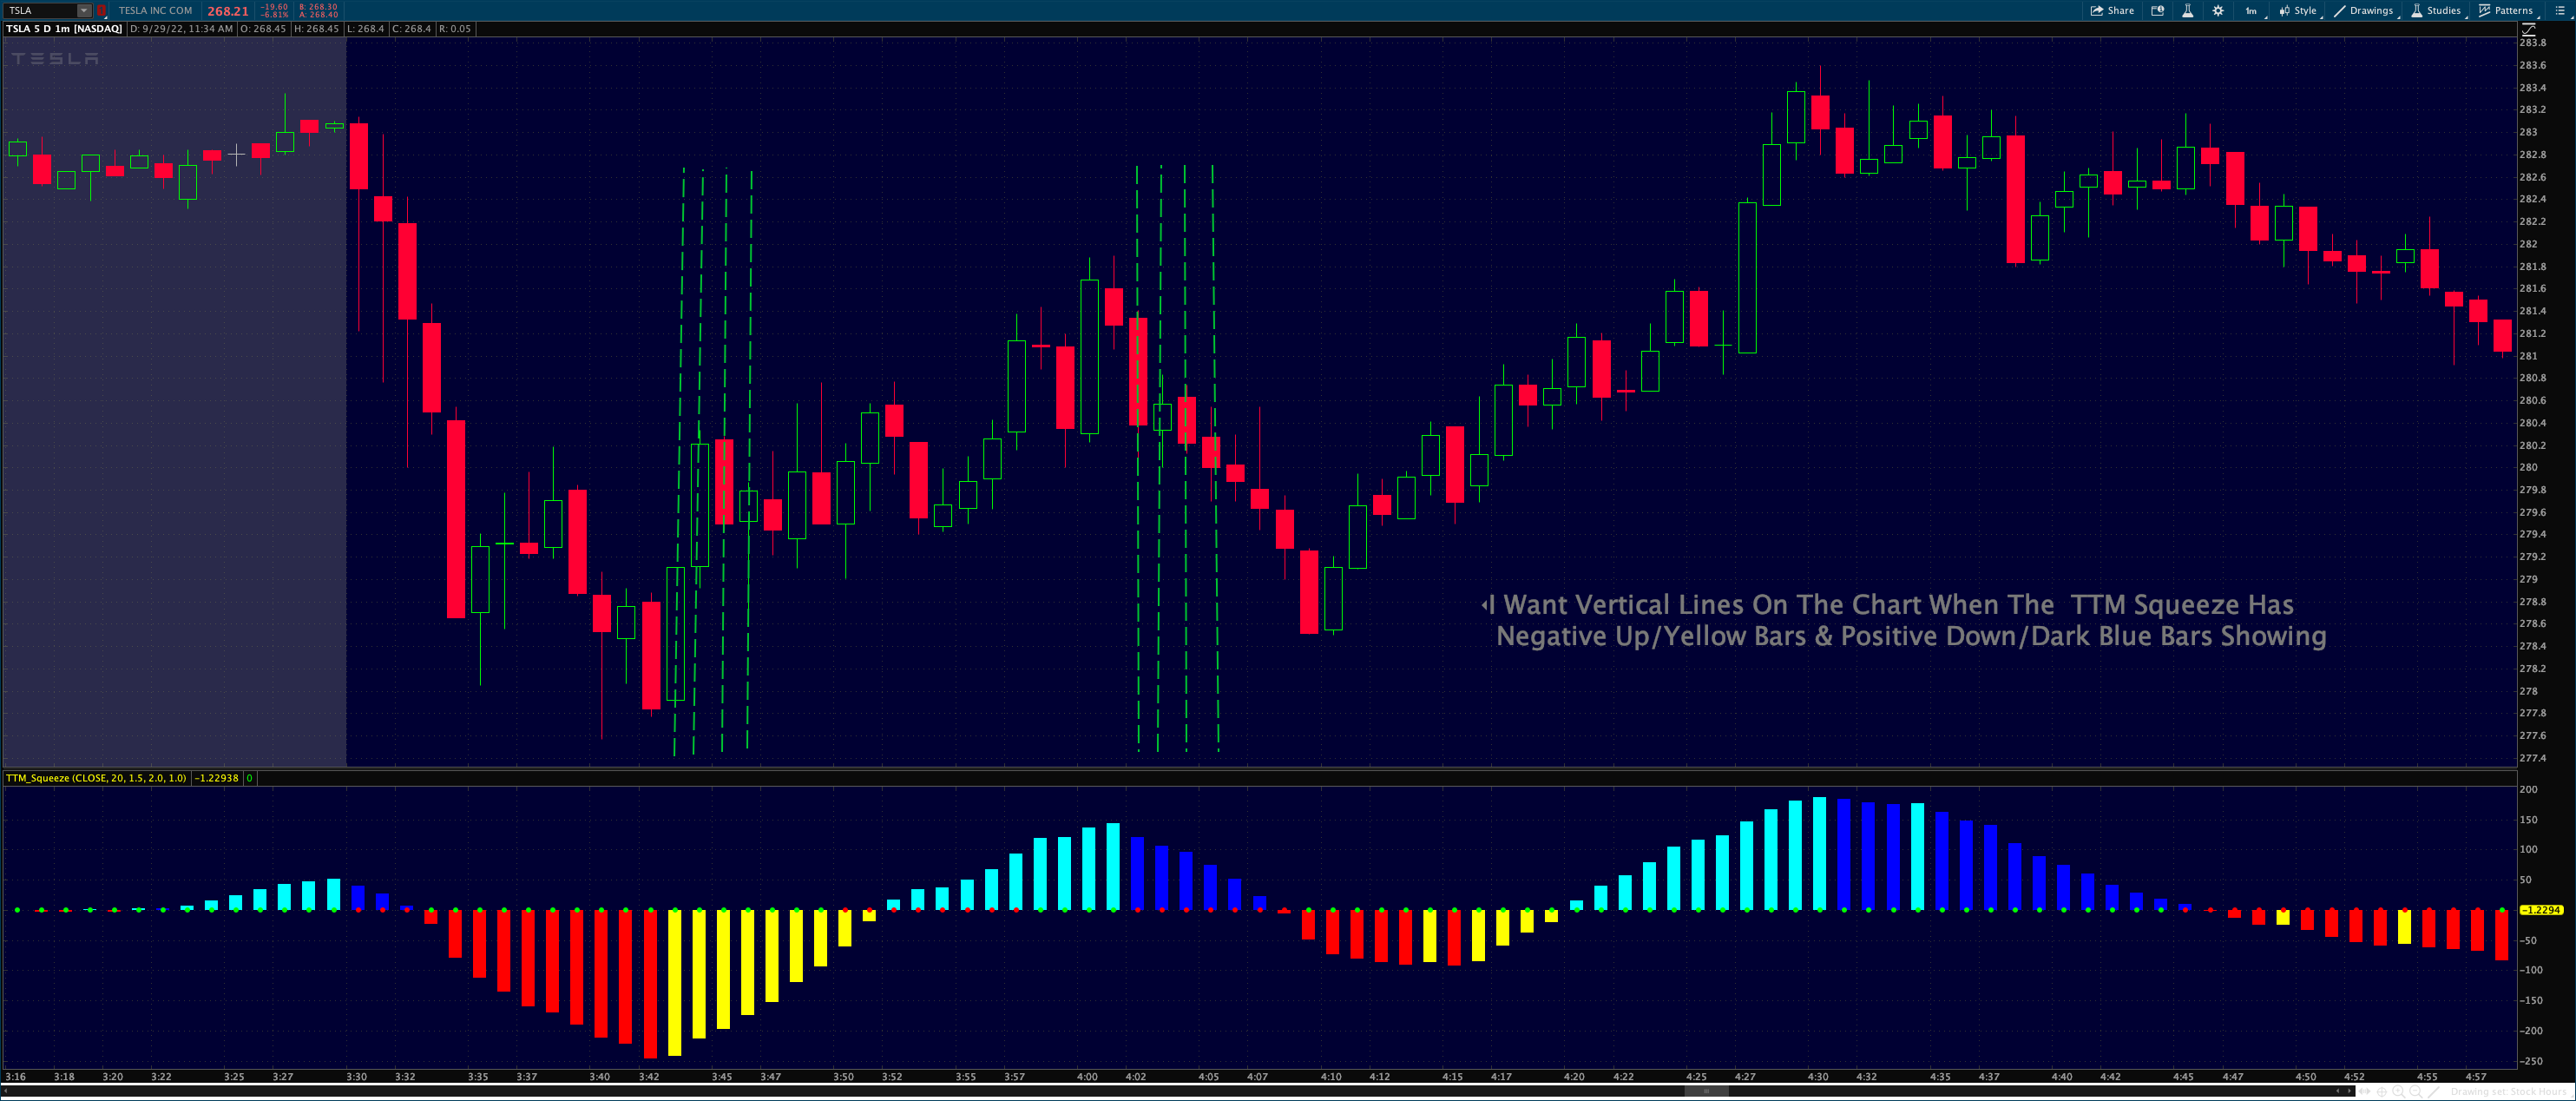
I am trying to create a thinkscript that shows vertical lines on the chart when the TTM Squeeze has negative up & positive down bars And No Vertical Lines When TTM Squeeze Has Positive Up Bars & Negative Down Bars. I added a picture to help explain.please help! Thank You Attachments:
Marked as spam
Asked on September 29, 2022 2:42 pm
183 views
|
|
Private answer
This is very similar to the last one you requested for the TTM Wave: https://www.hahn-tech.com/ans/plot-vertical-lines-when-ttm-wave-c-is-contracting/ I will say that I don't see any value in this for the rest of our viewers so this will be the last one of these "vertical line" solutions I provide you. From here on out you will have to learn from these examples and build them yourself.
Marked as spam
Answered on September 29, 2022 3:49 pm
|