plot when stock quickly drops 15 percent from high


Category:
0
0

Hi Pete,

Thanks again for all your hard work to help us TOS users.

Per our conversation, I am wanting to build a simple “backside” indicator for shorting low float runners, basically when a stock falls -15% within 10 minutes. Here are the specs I am needing for this indicator;

  1. Stock must be 30%+ on the day
  2. Stock must fall 15%
  3. within 10 minutes

I have attached a screenshot of what I am looking for.

Thanks again Pete for your help in this. I encourage everyone here to please donate to Pete to help him in helping others.

-Davide

RESOLVED
Marked as spam
Posted by (Questions: 7, Answers: 12)
Asked on July 26, 2019 2:49 pm
143 views
0

Donations are not solicited for posts to our Q&A forum. As a matter of fact we don't take "donations" on this site at all. There is a place for a "Voluntary Contribution". And it is just that. Not a donation at all. Consider it a tip jar. We don't want to confuse visitors by referring to the tip chart as a donation. Donations are for charitable organizations and Hahn-Tech, LLC is a FOR PROFIT enterprise.

Having cleared the air on that. I need to know where you came to know this as the so-called "backside indicator". I tied to Google that term and came up with absolutely nothing pertaining to stock trading. Why is this important? Because when we provide solutions in the Q&A forum we are creating a searchable knowledge based which is intended to serve a vast audience. So we need to make sure the titles of these questions use terms that will be used by folks trying to find this in a Google search.

So before I post a solution, please be so kind as to let me know (in a comment immediately below this one), exactly how I would search for this on Google and find similar setups to this one. I will then update the question title so that everyone trying to find this will immediately locate the solution here.

( at July 26, 2019 6:40 pm)
0
Pete, My apologies for the use of the wrong term; yes, gift or voluntary contribution would be more appropriate a word than donate. In regards to your question about the subject title, I just came up with a name to call the indicator, as I am not aware of anything like this currently in existence. You might call it a short signal, but backside indicator seem equally apropos to me as well. I understand you want others to be able to search for this, so if you feel a different word or phrase is more appropriate for the name of the indicator, I will leave it to you to change. I hope this clarifies the matter for you. Also Pete, please note that I am unable to edit my original post to include the screenshot. When I click on ”edit” it brings me to a blank page. This happens in both Chrome and IE. Davide
( at July 27, 2019 5:53 am)
0
Private answer

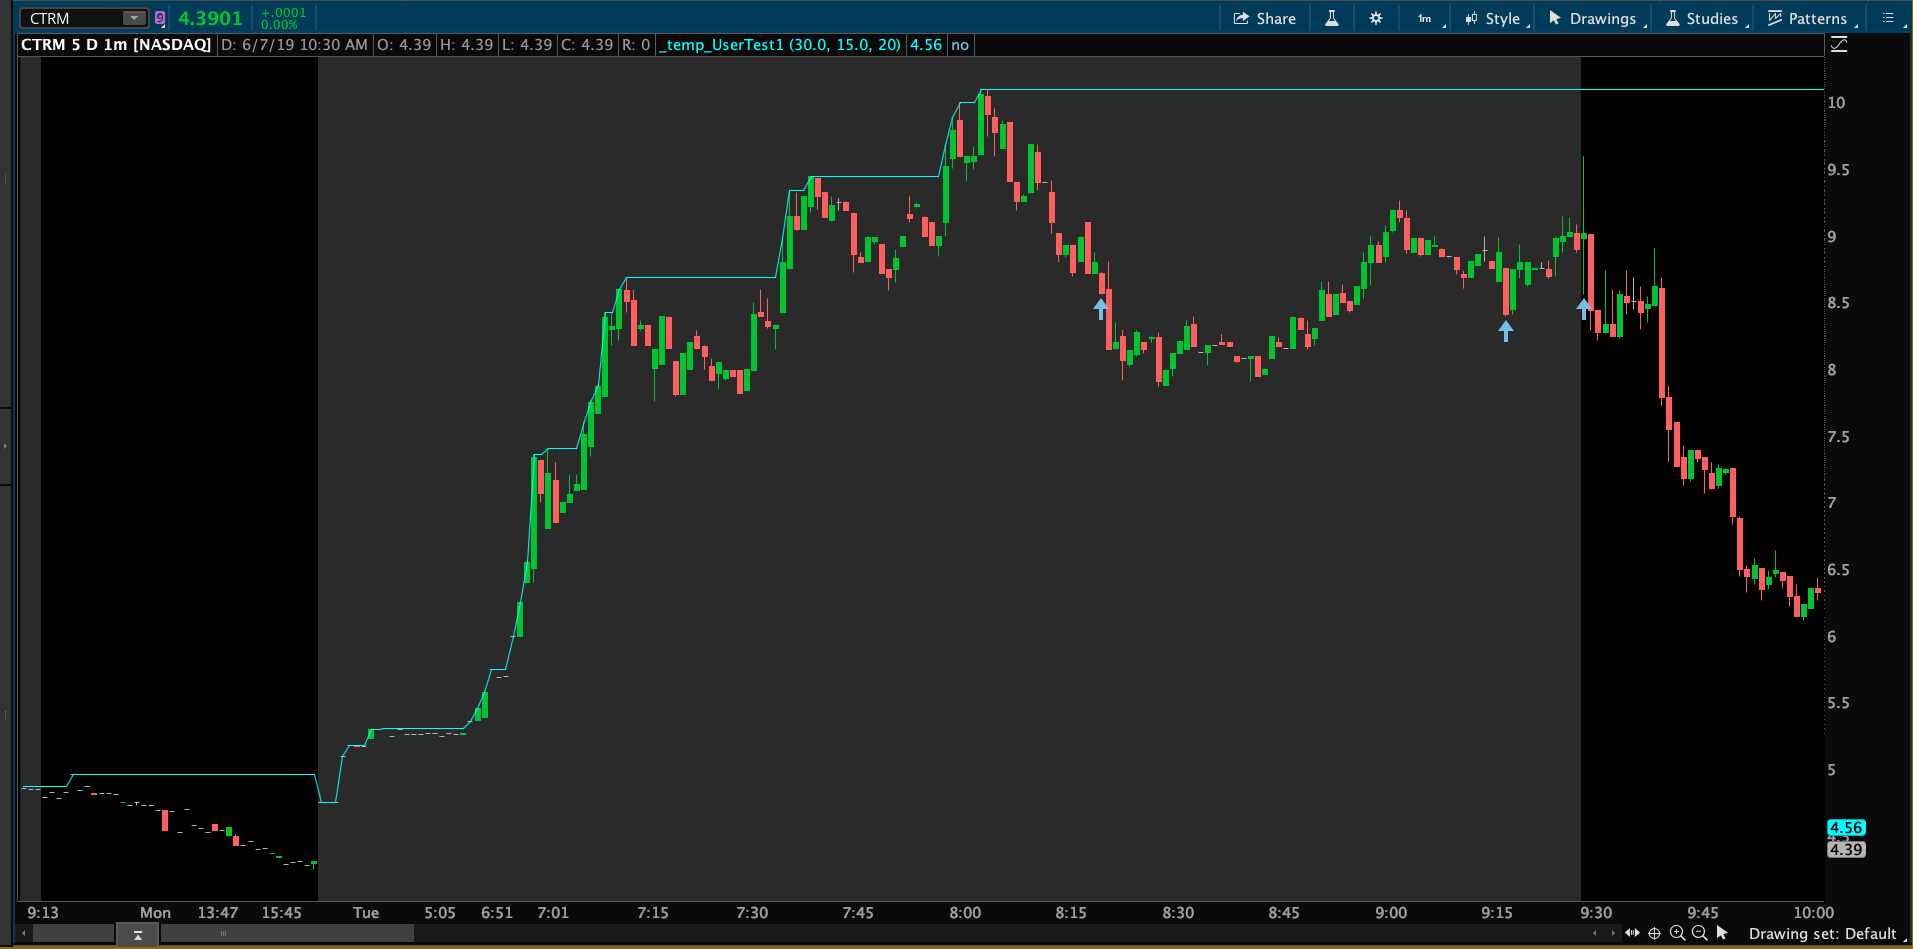
The screenshot you sent me via email does not fit the specifications you listed in your question above. The 15% drop occurred 17 bars from the high of the day. I have provided user inputs to your study so that the percent values can be adjusted as well as the number of bars from the high. In a 1 min chart your signal occurs 17 minutes after the high of day was reached. I used an arrow instead of a dot because the dot did not show up well on the chart.

Here is the code. Screenshot below shows the result.

Edit: Sorry but I was in a rush to get this posted and neglected to ensure all the rules I had accounted for in the code were applied correctly. The code below has been updated to ensure correct operation.

input percentGain = 30.0;
input percentDrop = 15.0;
input dropWithinBars = 10;
def previousDayClose = close(period = AggregationPeriod.DAY)[1];
def extendedSessionOne = RegularTradingEnd(GetYYYYMMDD()) <= GetTime(); def extendedSessionTwo = RegularTradingStart(GetYYYYMMDD()) >= GetTime();
def extendedSessionHours = extendedSessionTwo or extendedSessionOne;
def regularSessionHours = RegularTradingStart(GetYYYYMMDD()) <= GetTime() and !extendedSessionOne; rec highOfDay = if extendedSessionHours and !extendedSessionHours[1] then high else if high > highOfDay[1] then high else highOfDay[1];
plot highForToday = highOfDay;
def highEnough = highOfDay >= previousDayClose * (1 + (percentGain * 0.01));
def lowEnough = low <= highOfDay * (1 - (percentDrop * 0.01));
def highestBarOfDay = high < highOfDay and high[1] == highOfDay[1];
plot signal = highEnough and lowEnough and !lowEnough[1] and Highest(highestBarOfDay, dropWithinBars - 1) > 0;
signal.SetPaintingStrategy(PaintingStrategy.BOOLEAN_ARROW_UP);
signal.SetLineWeight(4);

Attachments:
Marked as spam
Posted by (Questions: 37, Answers: 4087)
Answered on July 27, 2019 11:54 am
0
Awesome, thanks so much Pete. Yes, you are correct regarding the chart of CTRM; the 15% dropped occurred 17 minutes after the high. 10 minutes was just a number I gave you. I was planning on tweaking this number in the code as needed. But I appreciate you taking it one step further and providing user inputs on the front end. Even better! I do have two questions about the code. The first arrow in your attached screenshot makes sense to me. But I see a 2nd and 3rd arrow near market open as well. I'm confused by why these arrows exist, since by this time it is more than 10 minutes (or 17 minutes in this case) since the stock never dropped 15% within the last 10 minutes of those points (From the bounce at 9:03am, the second arrow marks only a 9% drop since that high. I can send you a screenshot with a trendline to show you what I mean). My second question is related to the 30% minimum. If you go to the next day in this chart (CTRM on 6/8/19), I count a total of 11 arrows printed for that day. Yet the stock was never up more than 30% on the day. In fact, the stock was red on the day. So those arrows should never print, according to the specifications I provided. Is this something that can be easily fixed? Thanks Pete, -Davide
( at July 27, 2019 1:42 pm)
0
I saw your email before I saw our comments here explaining the details. I have updated the code in my answer to correct these issues.
( at July 27, 2019 4:39 pm)
0
Thanks Pete, works perfectly now. So grateful to you!
( at July 27, 2019 7:04 pm)