| ♥ 0 |
Hey Hahn, I have a lower study indicator that plots a positive or negative value. I need to add so that when the slow stochastics give a buy signal (the two lines cross, red over pink) a green up arrow is plotted where the number value is on the lower study. And when the slow stochastics give a sell signal (two lines cross, pink over red) a red down arrow is plotted where the number value is on the lower study. What I mean when I say “where the number value is on the lower study” is, for example, my lower study value is at -1.8 right now and a buy signal is given on the slow stochastics then the green up arrow will be plotted at -1.8 on the lower study. Thank you!
Marked as spam
|
|
Private answer
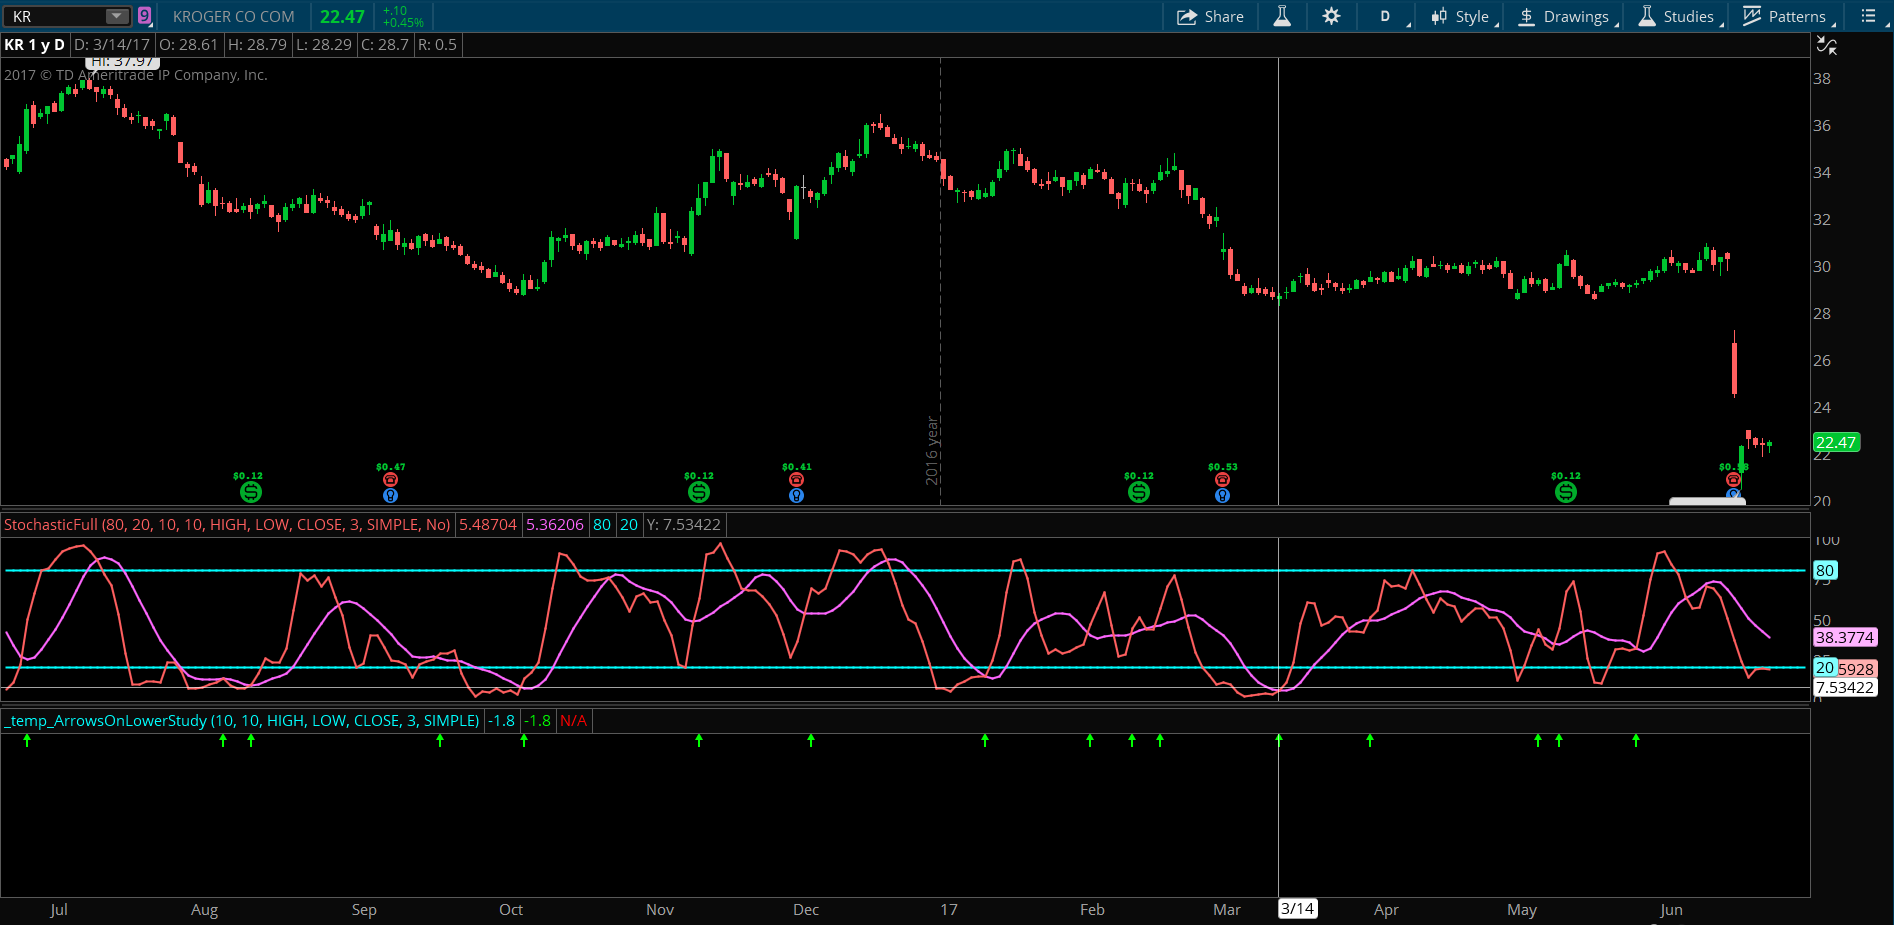
Since you did not provide the code for your lower study I am going to create a plot on this example, fixed at -1.8, called myLowerStudy. To make this work with your own lower study you will take the plot for that study and use it to replace the value of -1.8 in the sample code I am providing here. We have done numerous examples of line crossings, particularly using the Stochastic. So I am surprised you have not tried to hash this out on your own and post the code for us to review. If you want to learn something, be sure to make an attempt and post your code. But learning is optional. The code is listed below and I have included a screenshot showing this plotted in the lower subgraph of a chart. Attachments:
Marked as spam
Answered on June 22, 2017 11:06 am
|