| ♥ 0 |
Hello, here is my code: plot edArrow = if energy > 450 and volume > 200000 then energy else Double.NaN; This is on my indicator (which is not a lower study). The problem is that the arrow plots on my volume bar and I want to plot it under my candlestick. How can I do this? Thanks!
Marked as spam
|
|
Private answer
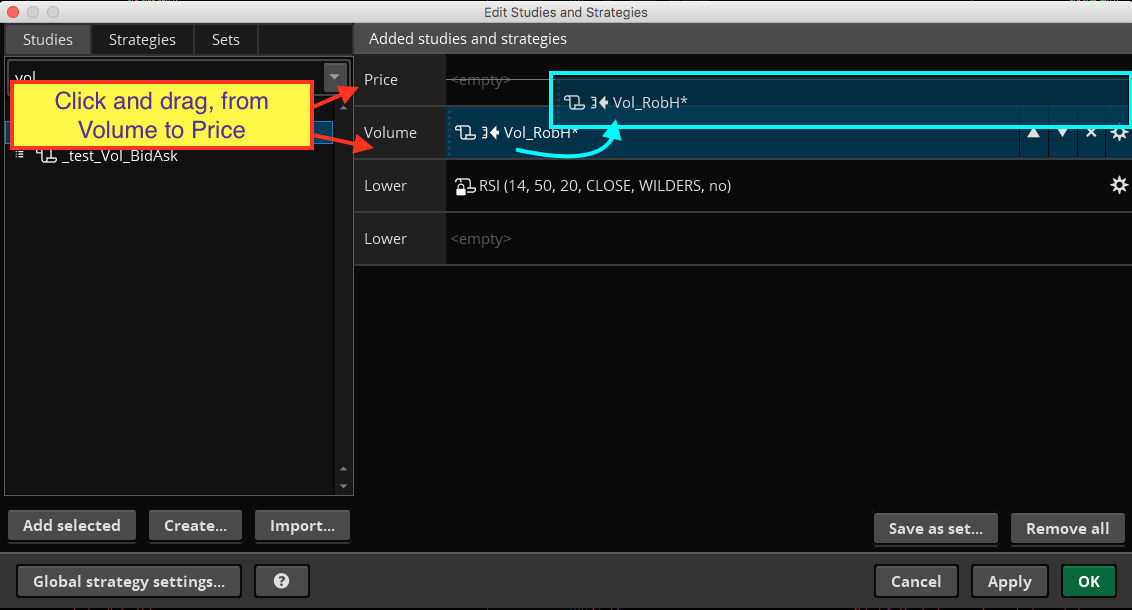
Well you did not provide the complete code so I have to guess that because part or all of your calculation involves volume the platform is making an assumption and putting it there. You may have to manually click and drag that study from the Volume subgraph and into the Price graph. See attached for some tips. Attachments:
Marked as spam
Answered on July 15, 2017 3:22 pm
|
Thank you, but the arrow is plotting at the arrow’s value (about 400) and I need the arrow to plot at the bottom of the candlestick its under. ?
This is because in your code that is exactly what you are telling it to do. Again, we only have a single line of code to work with here, which is:
plot edArrow = if energy > 450 and volume > 200000 then energy else Double.NaN;
If we pick this apart, we find you are assigning the value of the ’energy’ variable to the value of the plot. When you say ’if (is true)’ the value of the plot is assigned after the word ’then’. So rather than saying ’then energy’, you would say ’then low’:
plot edArrow = if energy > 450 and volume > 200000 then low else Double.NaN;