Plotting ProfitTargetLX as a lower study


Category:
0
0

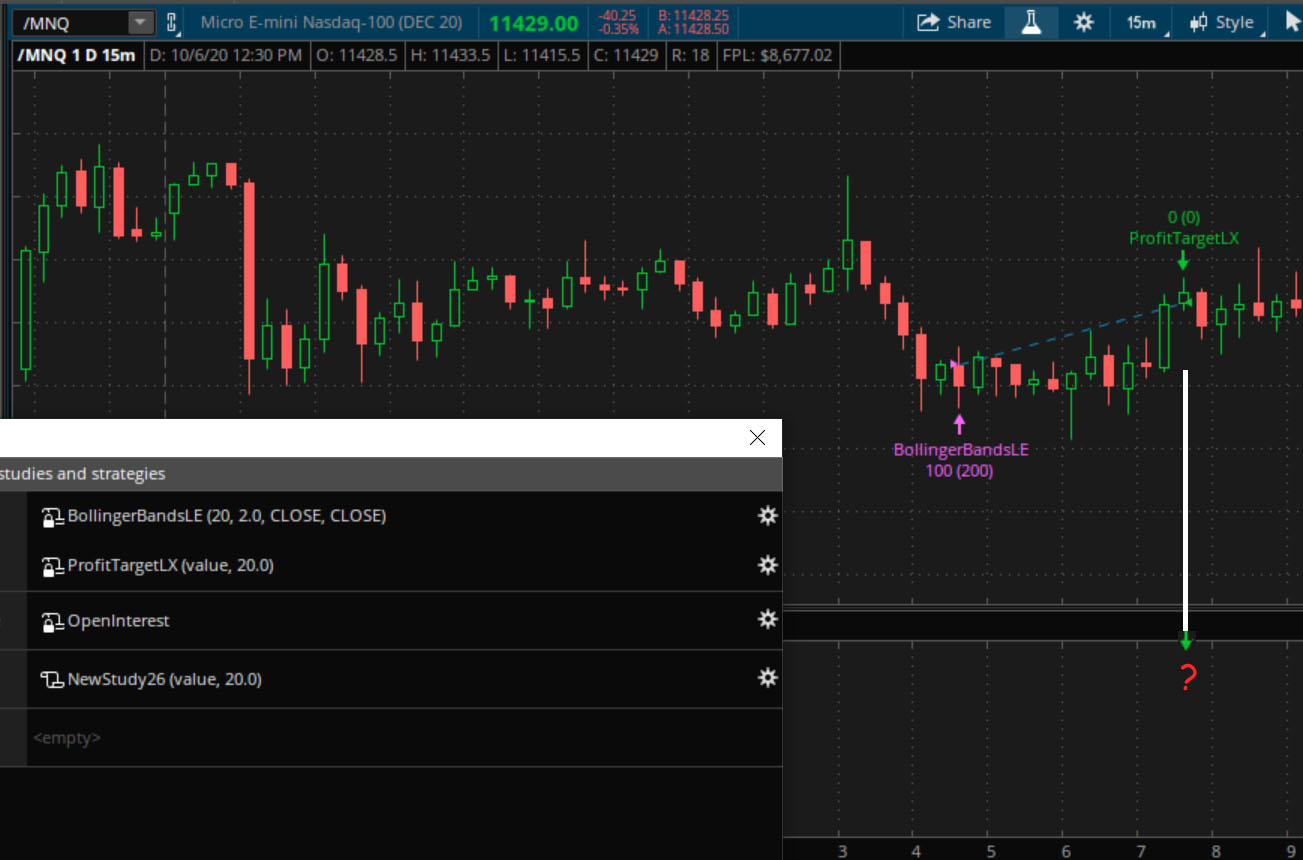
Hi Pete,

I am trying to do something seemingly straight forward, but unable to get the desired plot.

I want to plot the usual 1 or 0 in the lower study which corresponds to the in-built ProfitTargetLX strategy.

I copied the code (pasted below for your reference) and tried to plot however its not working. What am I doing wrong?

Screenshot is attached.

Thanks for your input as always.

Stock.


#
# TD Ameritrade IP Company, Inc. (c) 2011-2020
#

declare lower;

input offsetType = {default percent, value, tick};
input target = 0.75;

def entryPrice = entryPrice();
def mult;
switch (offsetType) {
case percent:
mult = entryPrice / 100;
case value:
mult = 1;
case tick:
mult = tickSize();
}
def targetPrice = entryPrice + target * mult;

plot lowersignal = If (high crosses above targetPrice, 1, 0);

—————————————————————————————-


Attachments:
Marked as spam
Posted by (Questions: 6, Answers: 3)
Asked on October 6, 2020 9:49 am
158 views
0
Private answer

Sorry but there is no solution for this. The code you are using includes a function named "EntryPrice()" and this function can only be used in a chart strategy. So you cannot use this as a chart study.

I was able to apply your code as a new chart strategy but it must plot on the upper price graph. I opened the Edit Studies window and changed the plot style to Boolean Arrow Down and it does plot an arrow where you would expect, but it plots on the upper price graph. This is the only way to use your modified code to plot a signal on the chart.

Marked as spam
Posted by (Questions: 37, Answers: 4089)
Answered on October 6, 2020 11:44 am