| ♥ 0 |
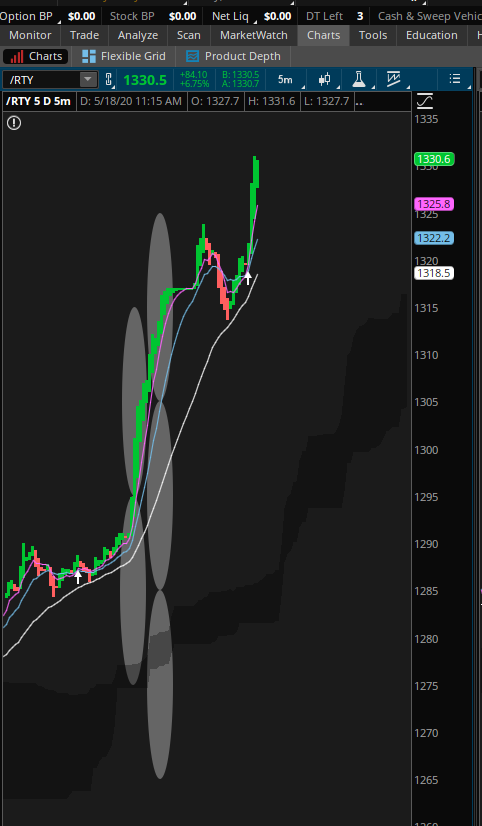
Hey, everyone. Monday – Friday, at about 7:40 am, Nadex puts out the parameters for their 8 am spreads, which are 200 points. I like putting those on TOS so I can see the ceilings and floors and place my trades accordingly. Up to now I have setting these all by hand every morning but am wondering if there is a way to set them all at once or create some kind of array/indicator that will do it all at once. I have attached a screenshot of how these look on my charts. I use and prefer ovals so that I can see where the spreads begin and end. The parameters of the ovals are 200 points top to bottom and 20 minutes wide. Any input into this is much appreciated. Thanks. Attachments:
Marked as spam
Asked on May 18, 2020 8:47 am
106 views
|