Price Crossing Above DMA Within 25 Days


Category:
0
0

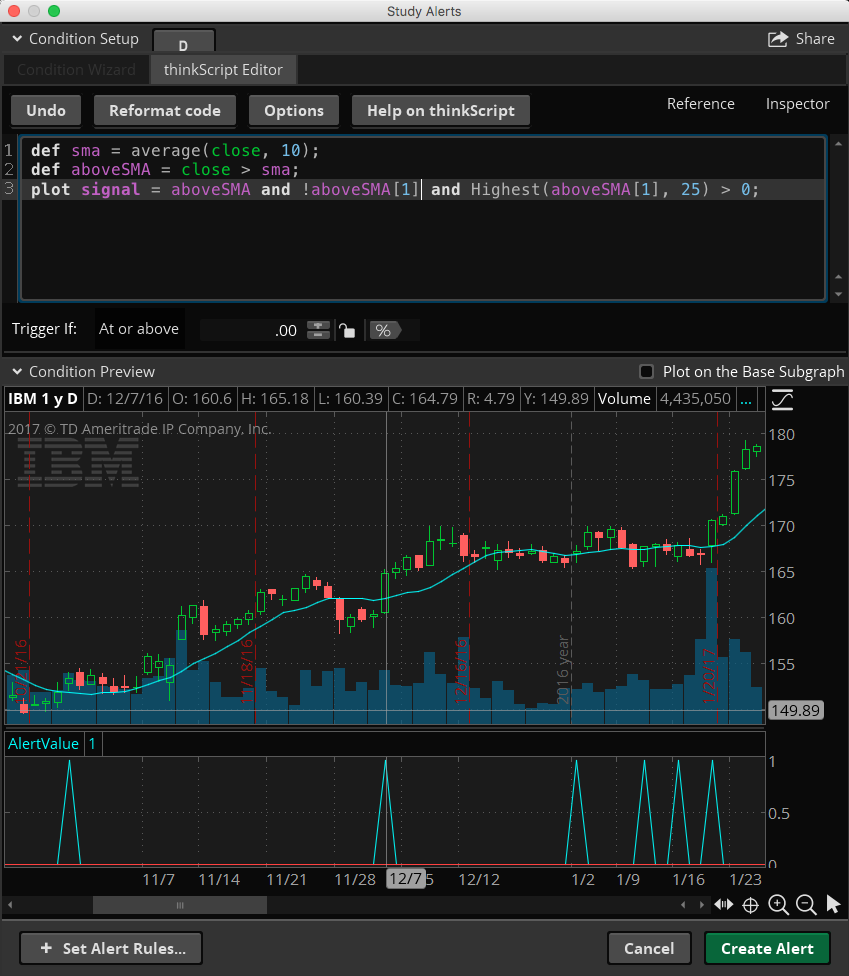
Hello Pete,

First, i want to say Thank You for all you do for the trading community,

Can you please help me out developing this quick stock scan

Stocks that cross below 10 dma and them cross above 10 dma within 25 days.

Regards


Editors Note: The title and URL of this post has been adjusted to better reflect the context. The original title: “Scan for Stocks” was redundant, given this post is already contained within the “Stock Scanners” topic.


Marked as spam
Posted by (Questions: 13, Answers: 13)
Asked on September 9, 2017 7:46 am
278 views
0

Please make sure future posts have a more descriptive title so other viewers will be able to search for and find your solution.

Regarding your request. You mention “10 dma”. I searched Thinkorswim studies and find one called DMA. This is a “displaced moving average which shifts the plot of the moving average backward or forward a specified number of bars”. Since you did not provide the displacement parameter I am guessing you are referring to something else entirely.

Please provide more details as to what you mean by “10 dma”.

( at September 9, 2017 9:39 am)
0
Private answer

Looking to scan for stocks that crossed below the 10 day moving average , then crossed above the 10 day moving average withing 25 days.

Marked as spam
Posted by (Questions: 13, Answers: 13)
Answered on September 9, 2017 4:42 pm
0
Private answer

Screenshot below shows how it looks as a Study Alert, which can be directly applied to a Scan.

def sma = average(close, 10);
def aboveSMA = close > sma;
plot signal = aboveSMA and !aboveSMA[1] and Highest(aboveSMA[1], 25) > 0;

Attachments:
Marked as spam
Posted by (Questions: 37, Answers: 4087)
Answered on September 10, 2017 8:59 am
0
Private answer

Thank you Pete, it works beautifully

Marked as spam
Posted by (Questions: 13, Answers: 13)
Answered on September 12, 2017 11:37 am