Hi
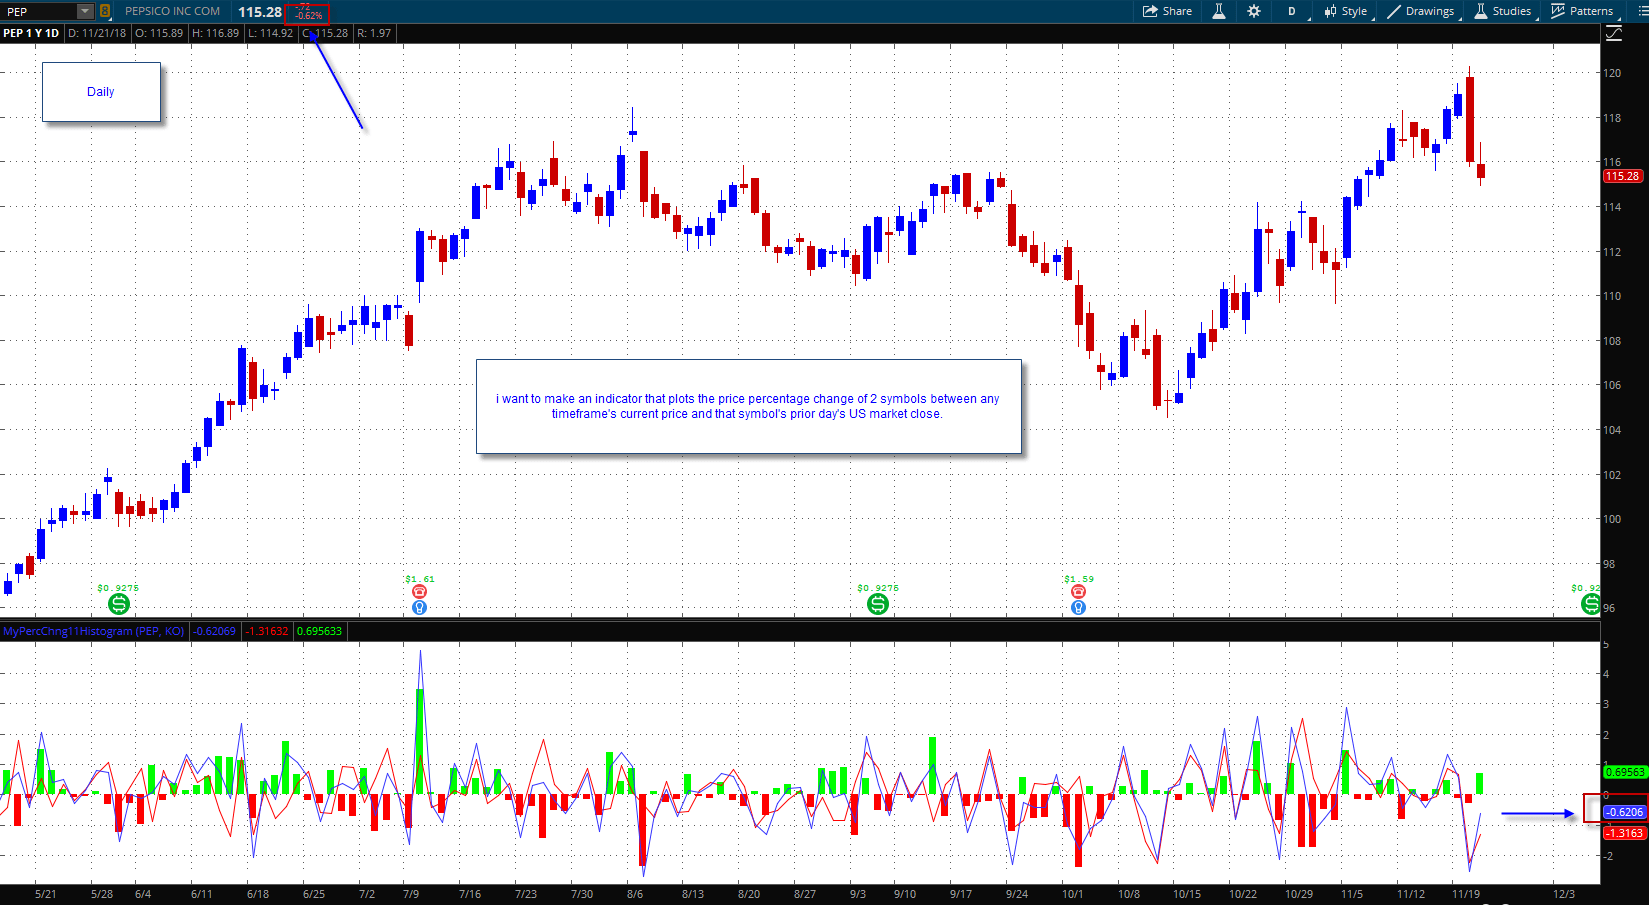
i want to make an indicator that plots the price percentage change of 2 symbols between any timeframe’s current price and that symbol’s prior day’s US market close. below is what i have so far.
i got this “price percentage change with histogram” to plot the difference between 2 symbols correctly on a “Daily” timeframe chart only. the code makes the calculation based off the prior “bar’s” close. i want to make it so the calculation of the prior bar is always the prior “day’s” US market close. it plots on lower timeframe charts like a 1-minute chart but it plots the change from the prior bar’s close which is just 1 minute prior and does not calculate it from the prior “Day’s” US market close like i want it to.
any ideas? charts attached for more clarity. any help would be greatly appreciated. Many Thanks.
below is the code on TOS for this:
#works on daily chart, need to get it to work on any timeframe like 1 minute
declare lower;
#Symbol Input
input SYMB1 = “PEP”;
input SYMB2 = “KO”;
def Price1 = close(symbol = SYMB1)[1];
def Price2 = close(symbol = SYMB1);
def Price3 = close(symbol = SYMB2)[1];
def Price4 = close(symbol = SYMB2);
plot PercentChg1 = ((Price2 – Price1) / Price1)*100;
plot PercentChg2 = ((Price4 – Price3) / Price3)*100;
plot Hist = (PercentChg1-PercentChg2);
Hist.setPaintingStrategy(paintingStrategy.HISTOGRAM);
Hist.setLineWeight(5);
Hist.assignValueColor(if PercentChg1 >=PercentChg2 then color.green else color.red);
*******************************************************************
******* below is extra code which might help ********************
********************************************************************
plot DailyClose = close(period=”DAY”)[1];
******************
#HINT: This study plots a chart label for Net Change and Percent Change from prior close (regardless of time period of the chart.
input period_Type = AggregationPeriod.DAY;
def begin = close(period = period_Type)[1];
def end = close(period = period_Type);
def NetChg = end – begin;
def PctChg = (end / begin) – 1;
AddLabel(yes, “Change from Prior close: ” + AsDollars(NetChg) + ” ” + AsPercent(PctChg), if NetChg > 0 then Color.GREEN else if NetChg < 0 then color.RED else color.LIGHT_GRAY);

Hi Pete,
thanks for your reply. i changed the code like you said and it seems to work the same as the older code on daily charts but, on other time frames like a 1 minute chart it looks like it only plots correctly for 1 of the 2 symbols but only the same symbol as the chart which is pulled up and the other symbol it only plots a straight line for it at a different value for each day (not sure which value it is). so, if i have a chart of PEP up then the indicator will plot the correct values for PEP but not the other symbol of KO. and if i have a chart of KO up then the indicator will plot the correct values for KO but not the other symbol of PEP. i tried to change the code around more but no luck. any more ideas? please see chart links. thanks again.
PEP price perc change 1min chart.png
https://pastepic.xyz/image/phE8W
KO price perc change 1min chart.png
https://pastepic.xyz/image/phFEh
updated code is below:
declare lower;
#Symbol Input
input SYMB1 = “PEP”;
input SYMB2 = “KO”;
def Price1 = close(symbol = SYMB1, period = AggregationPeriod.DAY)[1];
def Price2 = close(symbol = SYMB1);
def Price3 = close(symbol = SYMB2, period = AggregationPeriod.DAY)[1];
def Price4 = close(symbol = SYMB2);
plot PercentChg1 = ((Price2 – Price1) / Price1)*100;
plot PercentChg2 = ((Price4 – Price3) / Price3)*100;
plot Hist = (PercentChg1-PercentChg2);
Hist.setPaintingStrategy(paintingStrategy.HISTOGRAM);
Hist.setLineWeight(5);
Hist.assignValueColor(if PercentChg1 >=PercentChg2 then color.green else color.red);
I spent some time doing some troubleshooting. There appears to be a glitch in Thinkorswim. I’ll try to explain. When plotting this:
def Price1 = close(symbol = SYMB1, period = AggregationPeriod.DAY)[1];
On any chart except for PEP, the values are displayed from the daily time frame of PEP. However when you plot that on a chart of PEP, the daily data is replaced by current time frame data. So in place of daily data you get 1 min data. It’s a glitch. I know of no workaround. Perhaps you may consider reporting it to TDA support.
thanks Pete. obviously not what i was hoping to hear but it is what it is i guess. i will pass this on to TDA to see if they can do anything. thanks again.