Price was below 72 and 89 EMA closes above 72 EMA first time


Category:
0
0

Pete, I am looking for a scan to look for situations like the attached picture.  On a 1 min chart, the price was below both 72 and 89 EMA and first time 1 min bar closes above the 72 EMA I would like to see scan alert to this situation.

Attachments:
Marked as spam
Posted by (Questions: 6, Answers: 17)
Asked on January 25, 2019 4:50 pm
919 views
0

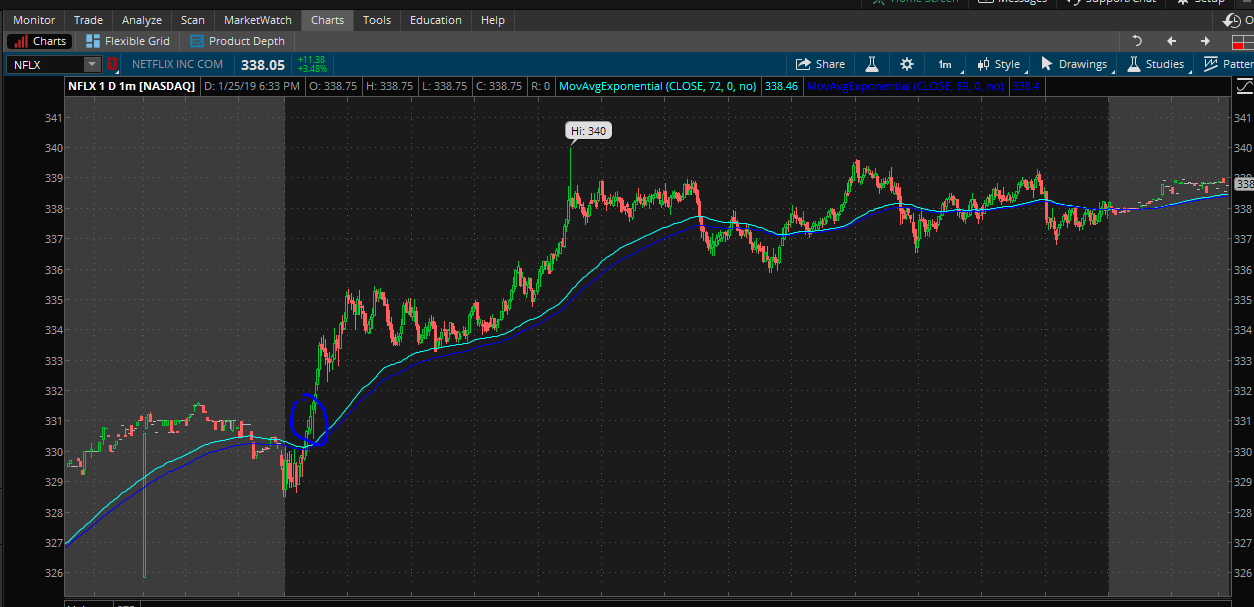
Does it matter what positions the two EMA’s are in? Does the 72 to be above the 89 in order form the cross above to be counted? Also, are you looking for just the close of the bar to cross above 72 ema or the entire candle including the wick? Hard to tell from your screenshot since you circled about 5 candles.

( at January 27, 2019 11:46 am)
0

Hi Pete,  I would like the 72 EMA to be above the 89 EMA to be counted and I would like the entire candle including wick to be above the EMA’s.

( at January 28, 2019 7:07 pm)
0
Private answer

I have not tested this but I’m pretty sure it should work:

input lengthOne = 72;
input lengthTwo = 89;
input averageTypeOne = AverageType.EXPONENTIAL;
input averageTypeTwo = AverageType.EXPONENTIAL;
input priceOne = close;
input priceTwo = close;
def maOne = MovingAverage(averageTypeOne, priceOne, lengthOne);
def maTwo = MovingAverage(averageTypeTwo, priceTwo, lengthTwo);
def stackedMA = maOne > maTwo;
def aboveMA = stackedMA and low > maOne;
def firstFullCandleAbove = aboveMA and !aboveMA[1];
plot scan = firstFullCandleAbove;

Marked as spam
Posted by (Questions: 37, Answers: 4087)
Answered on January 29, 2019 2:41 pm